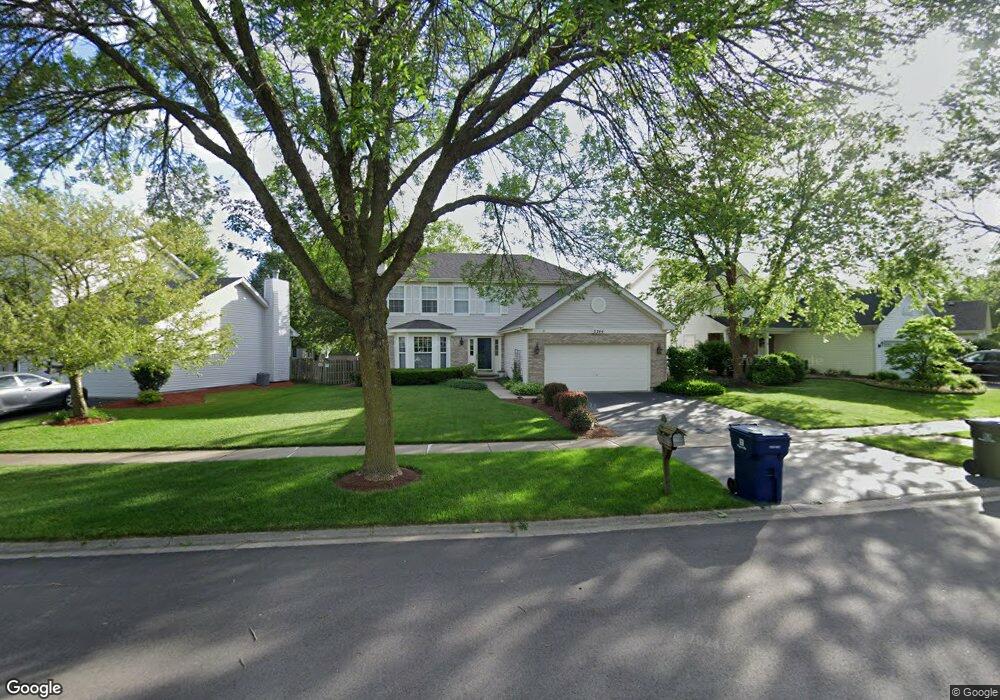
2744 Bluewater Cir Unit 2 Naperville, IL 60564
Wood Lake NeighborhoodEstimated Value: $518,000 - $595,000
4
Beds
3
Baths
1,997
Sq Ft
$274/Sq Ft
Est. Value
About This Home
This home is located at 2744 Bluewater Cir Unit 2, Naperville, IL 60564 and is currently estimated at $547,301, approximately $274 per square foot. 2744 Bluewater Cir Unit 2 is a home located in Will County with nearby schools including Williamsfield Elementary School, Welch Elementary School, and Ellsworth Elementary School.
Ownership History
Date
Name
Owned For
Owner Type
Purchase Details
Closed on
Jul 28, 2011
Sold by
Watt Michelle Banks
Bought by
Domasica Michael T and Domasica Adele M
Current Estimated Value
Home Financials for this Owner
Home Financials are based on the most recent Mortgage that was taken out on this home.
Original Mortgage
$240,000
Outstanding Balance
$165,940
Interest Rate
4.54%
Mortgage Type
New Conventional
Estimated Equity
$381,361
Purchase Details
Closed on
Oct 21, 2004
Sold by
Watt Andrew Johnston
Bought by
Watt Michelle Banks
Purchase Details
Closed on
Dec 17, 1996
Sold by
Woodlake Ltd Partnership
Bought by
Watt Andrew J and Watt Michelle B
Home Financials for this Owner
Home Financials are based on the most recent Mortgage that was taken out on this home.
Original Mortgage
$155,400
Interest Rate
7.25%
Create a Home Valuation Report for This Property
The Home Valuation Report is an in-depth analysis detailing your home's value as well as a comparison with similar homes in the area
Home Values in the Area
Average Home Value in this Area
Purchase History
| Date | Buyer | Sale Price | Title Company |
|---|---|---|---|
| Domasica Michael T | $300,000 | None Available | |
| Watt Michelle Banks | -- | -- | |
| Watt Andrew J | $194,500 | Chicago Title Insurance Co |
Source: Public Records
Mortgage History
| Date | Status | Borrower | Loan Amount |
|---|---|---|---|
| Open | Domasica Michael T | $240,000 | |
| Previous Owner | Watt Andrew J | $155,400 |
Source: Public Records
Tax History Compared to Growth
Tax History
| Year | Tax Paid | Tax Assessment Tax Assessment Total Assessment is a certain percentage of the fair market value that is determined by local assessors to be the total taxable value of land and additions on the property. | Land | Improvement |
|---|---|---|---|---|
| 2024 | $8,832 | $142,844 | $34,632 | $108,212 |
| 2023 | $8,832 | $126,188 | $30,594 | $95,594 |
| 2022 | $8,396 | $121,879 | $28,940 | $92,939 |
| 2021 | $8,018 | $116,075 | $27,562 | $88,513 |
| 2020 | $7,863 | $114,236 | $27,125 | $87,111 |
| 2019 | $7,725 | $111,017 | $26,361 | $84,656 |
| 2018 | $7,095 | $100,719 | $25,782 | $74,937 |
| 2017 | $6,983 | $98,118 | $25,116 | $73,002 |
| 2016 | $6,966 | $96,006 | $24,575 | $71,431 |
| 2015 | $6,992 | $92,314 | $23,630 | $68,684 |
| 2014 | $6,992 | $91,004 | $23,630 | $67,374 |
| 2013 | $6,992 | $91,004 | $23,630 | $67,374 |
Source: Public Records
Map
Nearby Homes
- 2736 Bluewater Cir
- 2543 Dewes Ln
- 2207 Sisters Ave
- 2866 Stonewater Dr Unit 102
- 2611 Cedar Glade Dr Unit 204
- 2511 Sheehan Dr Unit 203
- 2636 Salix Cir
- 28W555 Leverenz Rd
- 2949 Brossman St
- 2220 Waterleaf Ct Unit 204
- 2227 Waterleaf Ct Unit 203
- 3311 Fairmont Ave
- 1329 Neskola Ct
- 2301 Mecan Dr
- 3349 Rosecroft Ln Unit 2
- 1305 Morningstar Ct Unit 1A
- 1321 Galena Ct
- 3003 Kingbird Ct Unit IV
- 3408 Parliament Ln Unit 1
- 3316 Club Ct
- 2748 Bluewater Cir
- 2740 Bluewater Cir
- 2459 Warm Springs Ln
- 2752 Bluewater Cir
- 2455 Warm Springs Ln
- 2463 Warm Springs Ln
- 2312 Sedgwick Ct
- 2756 Bluewater Cir
- 2311 Sedgwick Ct
- 2451 Warm Springs Ln Unit 2
- 2467 Warm Springs Ln
- 2728 Bluewater Cir
- 2760 Bluewater Cir
- 2308 Sedgwick Ct
- 2735 Bluewater Cir Unit 2
- 2447 Warm Springs Ln
- 2755 Bluewater Cir
- 2307 Sedgwick Ct
- 2471 Warm Springs Ln
- 2724 Bluewater Cir Unit 2