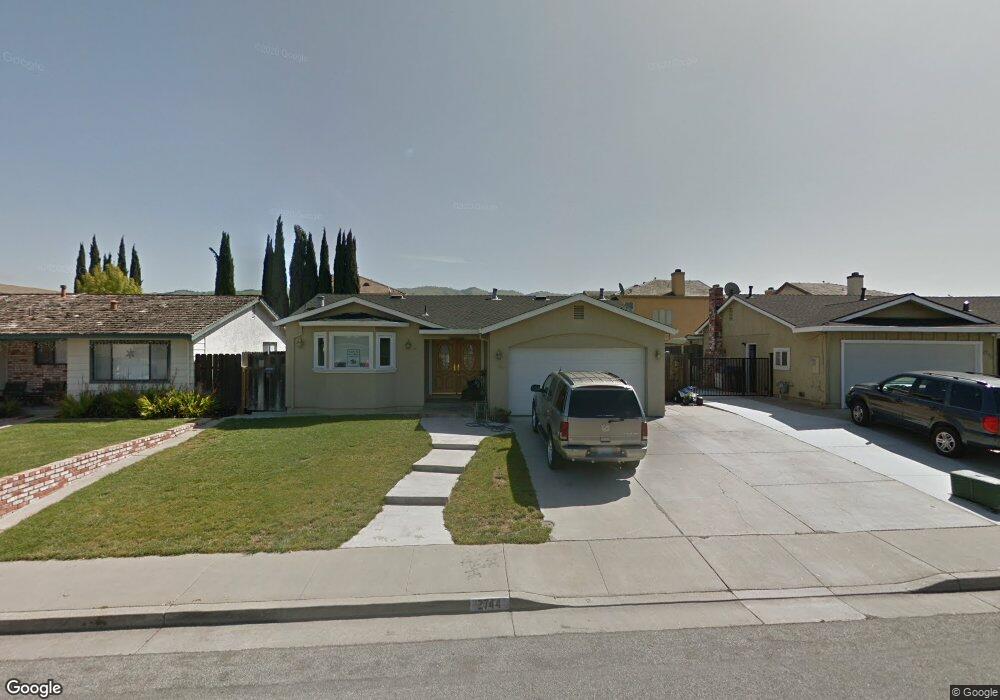
2744 Caraston Way San Jose, CA 95148
Hidden Glen NeighborhoodEstimated Value: $1,446,323 - $1,774,000
6
Beds
2
Baths
1,357
Sq Ft
$1,197/Sq Ft
Est. Value
About This Home
This home is located at 2744 Caraston Way, San Jose, CA 95148 and is currently estimated at $1,624,081, approximately $1,196 per square foot. 2744 Caraston Way is a home located in Santa Clara County with nearby schools including Norwood Creek Elementary School, Quimby Oak Middle School, and William C. Overfelt High School.
Ownership History
Date
Name
Owned For
Owner Type
Purchase Details
Closed on
Nov 12, 2016
Sold by
Park Carmen and Park Jagade T
Bought by
Park Jagade Tyce and Park Carmen Fimbrez
Current Estimated Value
Purchase Details
Closed on
Feb 29, 2012
Sold by
Park Carmen and Park Jagade T
Bought by
Park Carmen and Park Jagade T
Home Financials for this Owner
Home Financials are based on the most recent Mortgage that was taken out on this home.
Original Mortgage
$407,000
Interest Rate
3.83%
Mortgage Type
New Conventional
Purchase Details
Closed on
Sep 14, 1998
Sold by
Carmen Fimbrez and Park Carmen
Bought by
Park Jagade T and Park Carmen
Home Financials for this Owner
Home Financials are based on the most recent Mortgage that was taken out on this home.
Original Mortgage
$180,200
Interest Rate
6.89%
Create a Home Valuation Report for This Property
The Home Valuation Report is an in-depth analysis detailing your home's value as well as a comparison with similar homes in the area
Home Values in the Area
Average Home Value in this Area
Purchase History
| Date | Buyer | Sale Price | Title Company |
|---|---|---|---|
| Park Jagade Tyce | -- | None Available | |
| Park Carmen | -- | Old Republic Title Company | |
| Park Jagade T | -- | First American Title Guarant |
Source: Public Records
Mortgage History
| Date | Status | Borrower | Loan Amount |
|---|---|---|---|
| Closed | Park Carmen | $407,000 | |
| Closed | Park Jagade T | $180,200 |
Source: Public Records
Tax History Compared to Growth
Tax History
| Year | Tax Paid | Tax Assessment Tax Assessment Total Assessment is a certain percentage of the fair market value that is determined by local assessors to be the total taxable value of land and additions on the property. | Land | Improvement |
|---|---|---|---|---|
| 2025 | $7,414 | $462,542 | $115,149 | $347,393 |
| 2024 | $7,414 | $453,474 | $112,892 | $340,582 |
| 2023 | $7,252 | $444,583 | $110,679 | $333,904 |
| 2022 | $6,877 | $435,866 | $108,509 | $327,357 |
| 2021 | $7,610 | $427,321 | $106,382 | $320,939 |
| 2020 | $6,748 | $422,941 | $105,292 | $317,649 |
| 2019 | $6,570 | $414,649 | $103,228 | $311,421 |
| 2018 | $6,486 | $406,519 | $101,204 | $305,315 |
| 2017 | $6,364 | $398,549 | $99,220 | $299,329 |
| 2016 | $6,382 | $390,735 | $97,275 | $293,460 |
| 2015 | $5,913 | $384,866 | $95,814 | $289,052 |
| 2014 | $5,332 | $377,328 | $93,938 | $283,390 |
Source: Public Records
Map
Nearby Homes
- 2955 Vineyard Park Dr
- 2805 Gavilan Dr
- 2666 Hesselbein Way
- 2708 Glen Ferguson Cir
- 2552 Castleton Dr
- 2715 Sugarplum Dr
- 2707 Sugarplum Dr
- 2689 Vista Verde Dr
- 2574 Whispering Hills Cir Unit 2574
- 2629 Whispering Hills Dr
- 3344 Quesada Dr
- 2886 Damico Dr
- 3324 Trebol Ln
- 3211 Pentland Ct
- 3123 Oakgate Way
- 2896 Rathmann Dr
- 2467 Flint Ave
- 2885 Mantis Dr
- 3286 Dias Dr
- 2154 Pastoral Loop
- 2742 Caraston Way
- 2746 Caraston Way
- 2901 Vineyard Park Dr
- 2900 Vineyard Park Dr
- 2738 Caraston Way
- 2750 Caraston Way
- 2907 Vineyard Park Dr
- 2906 Vineyard Park Dr
- 2773 Vineyard Park Place
- 2734 Caraston Way
- 2743 Caraston Way
- 2747 Caraston Way
- 2913 Vineyard Park Dr
- 2912 Vineyard Park Dr
- 2767 Vineyard Park Place
- 2739 Caraston Way
- 2754 Caraston Way
- 2751 Caraston Way
- 2919 Vineyard Park Dr
- 2761 Vineyard Park Place