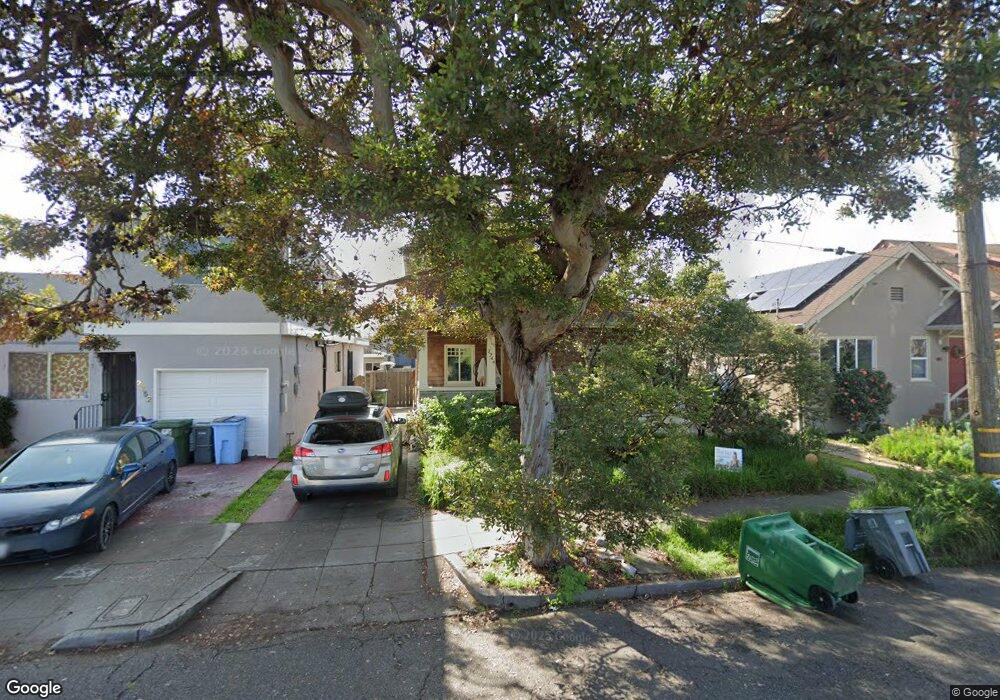
2744 Mabel St Berkeley, CA 94702
West Berkeley NeighborhoodEstimated Value: $952,000 - $1,922,000
3
Beds
1
Bath
1,249
Sq Ft
$1,124/Sq Ft
Est. Value
About This Home
This home is located at 2744 Mabel St, Berkeley, CA 94702 and is currently estimated at $1,403,337, approximately $1,123 per square foot. 2744 Mabel St is a home located in Alameda County with nearby schools including Malcolm X Elementary School, Oxford Elementary School, and Washington Elementary School.
Ownership History
Date
Name
Owned For
Owner Type
Purchase Details
Closed on
Sep 16, 2009
Sold by
Jorgensen Nelcie and Ross Douglas F
Bought by
Jorgensen Kenneth E and Jorgensen Susan E
Current Estimated Value
Home Financials for this Owner
Home Financials are based on the most recent Mortgage that was taken out on this home.
Original Mortgage
$306,000
Outstanding Balance
$200,732
Interest Rate
5.25%
Mortgage Type
New Conventional
Estimated Equity
$1,202,605
Purchase Details
Closed on
Nov 4, 2002
Sold by
Jorgensen Kenneth E and Jorgensen Susan E
Bought by
Jorgensen Kenneth E and Jorgensen Susan E
Purchase Details
Closed on
Aug 30, 2002
Sold by
Hruska Margaret Lowrie
Bought by
Jorgensen Nelcie M and Ross Douglas F
Home Financials for this Owner
Home Financials are based on the most recent Mortgage that was taken out on this home.
Original Mortgage
$296,000
Interest Rate
6.29%
Purchase Details
Closed on
Feb 3, 2002
Sold by
Hruska Paul R
Bought by
Hruska Paul R and Hruska Margaret Lowrie
Purchase Details
Closed on
Aug 16, 1995
Sold by
Hruska Paul R and Tillie E Mcconville Trust
Bought by
Hruska Paul R
Purchase Details
Closed on
Jun 10, 1995
Sold by
Mcconville Tillie E
Bought by
Mcconville Tillie E and Hruska Paul R
Create a Home Valuation Report for This Property
The Home Valuation Report is an in-depth analysis detailing your home's value as well as a comparison with similar homes in the area
Home Values in the Area
Average Home Value in this Area
Purchase History
| Date | Buyer | Sale Price | Title Company |
|---|---|---|---|
| Jorgensen Kenneth E | -- | Old Republic Title Company | |
| Jorgensen Nelcie | -- | Old Republic Title Company | |
| Jorgensen Kenneth E | -- | -- | |
| Jorgensen Nelcie M | $370,000 | Old Republic Title Company | |
| Hruska Paul R | -- | -- | |
| Hruska Paul R | -- | -- | |
| Mcconville Tillie E | -- | -- |
Source: Public Records
Mortgage History
| Date | Status | Borrower | Loan Amount |
|---|---|---|---|
| Open | Jorgensen Nelcie | $306,000 | |
| Closed | Jorgensen Nelcie M | $296,000 | |
| Closed | Jorgensen Nelcie M | $37,000 |
Source: Public Records
Tax History
| Year | Tax Paid | Tax Assessment Tax Assessment Total Assessment is a certain percentage of the fair market value that is determined by local assessors to be the total taxable value of land and additions on the property. | Land | Improvement |
|---|---|---|---|---|
| 2025 | $11,913 | $673,903 | $160,750 | $520,153 |
| 2024 | $11,913 | $660,555 | $157,598 | $509,957 |
| 2023 | $11,649 | $654,469 | $154,509 | $499,960 |
| 2022 | $11,401 | $634,638 | $151,480 | $490,158 |
| 2021 | $11,403 | $622,061 | $148,511 | $480,550 |
| 2020 | $10,684 | $622,614 | $146,989 | $475,625 |
| 2019 | $10,149 | $610,408 | $144,107 | $466,301 |
| 2018 | $9,955 | $598,443 | $141,283 | $457,160 |
| 2017 | $10,171 | $586,711 | $138,513 | $448,198 |
| 2016 | $8,699 | $532,661 | $135,798 | $396,863 |
| 2015 | $6,920 | $445,864 | $133,759 | $312,105 |
| 2014 | $6,859 | $437,131 | $131,139 | $305,992 |
Source: Public Records
Map
Nearby Homes
- 2751 Wallace St
- 2747 San Pablo Ave Unit 507
- 1034 Grayson St
- 1010 Grayson St
- 1237 Ashby Ave
- 2790 Sacramento St
- 2782 Sacramento St
- 1450 Ward St
- 2774 Sacramento St
- 1314 Ashby Ave
- 2758 Sacramento St
- 2750 Sacramento St
- 2922 Stanton St
- 3032 Mabel St
- 1142 Dwight Way
- 1118 Dwight Way
- 1515 Derby St
- 1530 Stuart St
- 1092 Dwight Way
- 1080 67th St
- 2742 Mabel St
- 2740 Mabel St
- 2751 Mathews St
- 2753 Mathews St
- 2756 Mabel St
- 2747 Mathews St
- 2738 Mabel St
- 2755 Mathews St
- 2745 Mathews St
- 2760 Mabel St
- 2736 Mabel St
- 2759 Mathews St
- 2741 Mathews St
- 2761 Mathews St
- 2737 Mathews St
- 2770 Mabel St
- 2734 Mabel St
- 2765 Mathews St
- 2735 Mathews St
- 2732 Mabel St
Your Personal Tour Guide
Ask me questions while you tour the home.