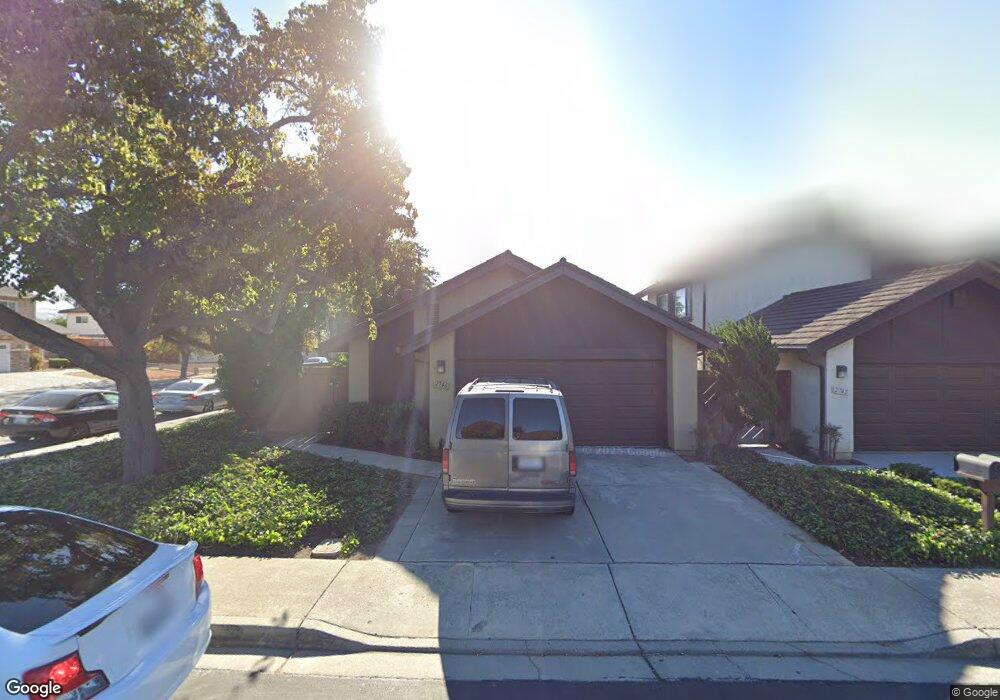
2746 Mabury Square San Jose, CA 95133
Penitencia NeighborhoodEstimated Value: $1,214,196 - $1,455,000
3
Beds
2
Baths
1,260
Sq Ft
$1,053/Sq Ft
Est. Value
About This Home
This home is located at 2746 Mabury Square, San Jose, CA 95133 and is currently estimated at $1,327,049, approximately $1,053 per square foot. 2746 Mabury Square is a home located in Santa Clara County with nearby schools including Summerdale Elementary School, Piedmont Middle School, and Independence High School.
Ownership History
Date
Name
Owned For
Owner Type
Purchase Details
Closed on
Jan 14, 2002
Sold by
Handong Jeffrey
Bought by
Handong Jeffrey and Ji Bei Bei
Current Estimated Value
Home Financials for this Owner
Home Financials are based on the most recent Mortgage that was taken out on this home.
Original Mortgage
$136,244
Interest Rate
6.84%
Purchase Details
Closed on
Oct 21, 1993
Sold by
Potter G R and Potter George R
Bought by
Handong Jeffrey
Home Financials for this Owner
Home Financials are based on the most recent Mortgage that was taken out on this home.
Original Mortgage
$148,000
Interest Rate
6.95%
Create a Home Valuation Report for This Property
The Home Valuation Report is an in-depth analysis detailing your home's value as well as a comparison with similar homes in the area
Home Values in the Area
Average Home Value in this Area
Purchase History
| Date | Buyer | Sale Price | Title Company |
|---|---|---|---|
| Handong Jeffrey | -- | Fidelity National Title Co | |
| Handong Jeffrey | $182,000 | Old Republic Title Company |
Source: Public Records
Mortgage History
| Date | Status | Borrower | Loan Amount |
|---|---|---|---|
| Closed | Handong Jeffrey | $136,244 | |
| Closed | Handong Jeffrey | $148,000 |
Source: Public Records
Tax History Compared to Growth
Tax History
| Year | Tax Paid | Tax Assessment Tax Assessment Total Assessment is a certain percentage of the fair market value that is determined by local assessors to be the total taxable value of land and additions on the property. | Land | Improvement |
|---|---|---|---|---|
| 2025 | $5,396 | $308,883 | $123,549 | $185,334 |
| 2024 | $5,396 | $302,827 | $121,127 | $181,700 |
| 2023 | $5,271 | $296,890 | $118,752 | $178,138 |
| 2022 | $5,242 | $291,070 | $116,424 | $174,646 |
| 2021 | $5,046 | $285,364 | $114,142 | $171,222 |
| 2020 | $4,868 | $282,439 | $112,972 | $169,467 |
| 2019 | $4,679 | $276,902 | $110,757 | $166,145 |
| 2018 | $4,601 | $271,474 | $108,586 | $162,888 |
| 2017 | $4,609 | $266,152 | $106,457 | $159,695 |
| 2016 | $4,415 | $260,934 | $104,370 | $156,564 |
| 2015 | $4,357 | $257,016 | $102,803 | $154,213 |
| 2014 | $3,821 | $251,983 | $100,790 | $151,193 |
Source: Public Records
Map
Nearby Homes
- 2714 Mabury Square
- 2598 Mabury Square
- 714 N Capitol Ave
- 2806 Glauser Dr
- 825 N Capitol Ave Unit 4
- 674 Galleon Ct
- 2623 Gimelli Place Unit 139
- 709 Whitewater Ct Unit 44
- 981 Harcot Ct
- 994 Harcot Ct
- 997 Harcot Ct
- 982 Harcot Ct
- 998 Harcot Ct
- 931 ToMcOt Ct
- 990 Harcot Ct
- 2599 Easton Ln Unit 108
- 2599 Easton Ln Unit 109
- 970 E Harcot Ct
- 693 Kirk Glen Dr
- 633 Easton Dr
- 2742 Mabury Square
- 795 Clearview Dr
- 2738 Mabury Square
- 781 Clearview Dr
- 807 Clearview Dr
- 790 Clearview Dr
- 775 Clearview Dr
- 780 Clearview Dr
- 2726 Mabury Square
- 811 Clearview Dr
- 2730 Mabury Square
- 2750 Mabury Square
- 2722 Mabury Square
- 2751 Glen Heather Dr
- 769 Clearview Dr
- 815 Clearview Dr
- 2754 Mabury Square
- 2718 Mabury Square
- 2755 Glen Firth Dr
- 761 Clearview Dr