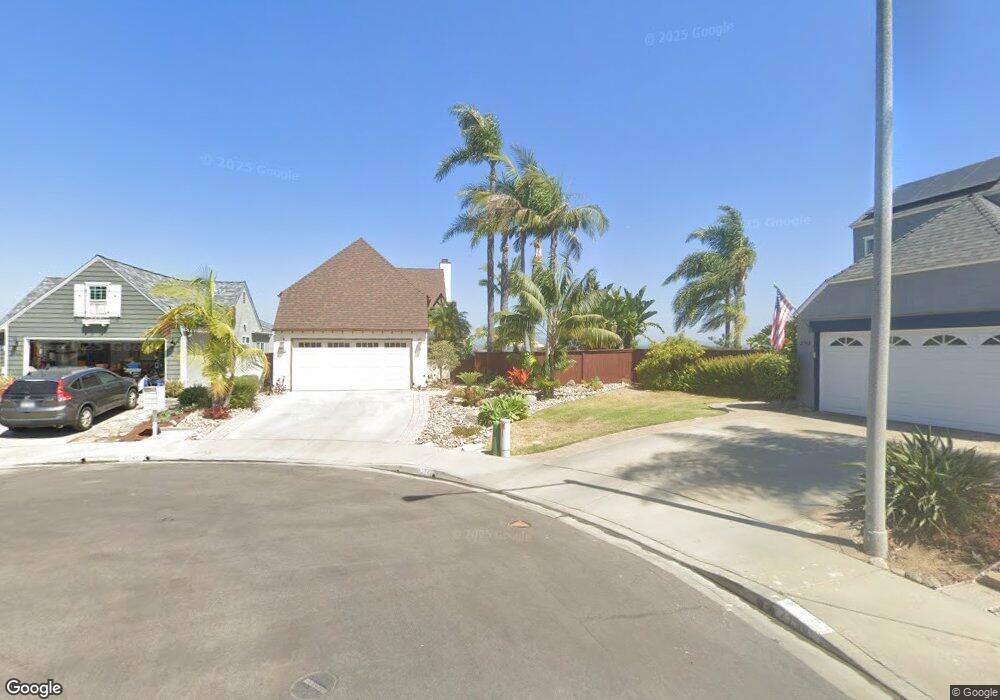
2746 Windsor Ct Unit 3 Carlsbad, CA 92010
Tamarack Point NeighborhoodEstimated Value: $1,094,000 - $1,471,000
3
Beds
3
Baths
1,740
Sq Ft
$752/Sq Ft
Est. Value
About This Home
This home is located at 2746 Windsor Ct Unit 3, Carlsbad, CA 92010 and is currently estimated at $1,308,148, approximately $751 per square foot. 2746 Windsor Ct Unit 3 is a home located in San Diego County with nearby schools including Hope Elementary School, Calavera Hills Middle, and Carlsbad High School.
Ownership History
Date
Name
Owned For
Owner Type
Purchase Details
Closed on
Jan 21, 2004
Sold by
Spickard Susan Schultz
Bought by
Schultz Spickard Susan
Current Estimated Value
Purchase Details
Closed on
Feb 7, 1995
Sold by
Wells Fargo Bank N A
Bought by
Spickard Susan Schultz
Home Financials for this Owner
Home Financials are based on the most recent Mortgage that was taken out on this home.
Original Mortgage
$179,100
Interest Rate
9.09%
Purchase Details
Closed on
Oct 27, 1994
Sold by
Staples John M and Staples Aileen M
Bought by
Wells Fargo Bank Na
Purchase Details
Closed on
Mar 13, 1990
Create a Home Valuation Report for This Property
The Home Valuation Report is an in-depth analysis detailing your home's value as well as a comparison with similar homes in the area
Home Values in the Area
Average Home Value in this Area
Purchase History
| Date | Buyer | Sale Price | Title Company |
|---|---|---|---|
| Schultz Spickard Susan | -- | -- | |
| Spickard Susan Schultz | $199,000 | Fidelity National Title | |
| Wells Fargo Bank Na | $170,000 | North American Title Company | |
| -- | $284,900 | -- |
Source: Public Records
Mortgage History
| Date | Status | Borrower | Loan Amount |
|---|---|---|---|
| Closed | Spickard Susan Schultz | $179,100 |
Source: Public Records
Tax History Compared to Growth
Tax History
| Year | Tax Paid | Tax Assessment Tax Assessment Total Assessment is a certain percentage of the fair market value that is determined by local assessors to be the total taxable value of land and additions on the property. | Land | Improvement |
|---|---|---|---|---|
| 2025 | $3,476 | $334,228 | $154,259 | $179,969 |
| 2024 | $3,476 | $327,676 | $151,235 | $176,441 |
| 2023 | $3,456 | $321,252 | $148,270 | $172,982 |
| 2022 | $3,402 | $314,954 | $145,363 | $169,591 |
| 2021 | $3,375 | $308,779 | $142,513 | $166,266 |
| 2020 | $3,352 | $305,614 | $141,052 | $164,562 |
| 2019 | $3,291 | $299,623 | $138,287 | $161,336 |
| 2018 | $3,151 | $293,749 | $135,576 | $158,173 |
| 2017 | $3,098 | $287,990 | $132,918 | $155,072 |
| 2016 | $2,972 | $282,344 | $130,312 | $152,032 |
| 2015 | $2,960 | $278,104 | $128,355 | $149,749 |
| 2014 | $2,910 | $272,657 | $125,841 | $146,816 |
Source: Public Records
Map
Nearby Homes
- 4583 Chancery Ct
- 4375 Stanford St
- 4459 Dorchester Place
- 2754 Inverness Dr
- 4350 Point Reyes Ct
- 2543 Glasgow Dr
- 2591 Regent Rd Unit 52
- 4439 Salisbury Dr
- 4405 Sierra Morena Ave
- 4847 Nelson Ct
- 2880 Englewood Way
- 4427 Trieste Dr
- 2572 Chamomile Ln
- Plan 2212 Modeled at Coral Springs
- 4654 Catmint Ln
- 4600 Catmint Ln
- 2579 Elderberry Ln
- Plan 1994 Modeled at Coral Springs
- 4636 Catmint Ln
- 2555 Elderberry Ln
- 2744 Windsor Ct
- 2742 Southampton Rd
- 2748 Windsor Ct
- 2740 Southampton Rd
- 2750 Windsor Ct
- 2752 Windsor Ct
- 2754 Windsor Ct
- 4575 Picadilly Ct
- 4613 Buckingham Ln
- 4611 Buckingham Ln Unit 3
- 4615 Buckingham Ln
- 4571 Picadilly Ct
- 4579 Picadilly Ct Unit 3
- 2756 Southampton Rd
- 4617 Buckingham Ln
- 4567 Picadilly Ct
- 4563 Picadilly Ct
- 4583 Picadilly Ct
- 4535 Picadilly Ct
- 4619 Buckingham Ln Unit 3