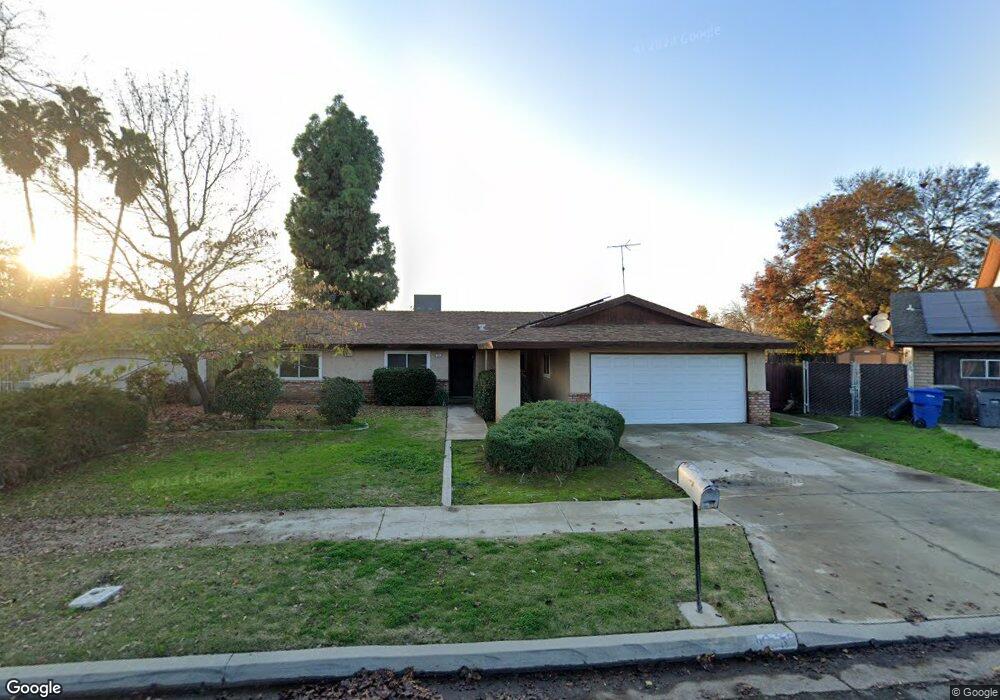
275 N Sylmar Ave Fresno, CA 93727
Sunnyside NeighborhoodEstimated Value: $361,729 - $372,000
3
Beds
2
Baths
1,640
Sq Ft
$224/Sq Ft
Est. Value
About This Home
This home is located at 275 N Sylmar Ave, Fresno, CA 93727 and is currently estimated at $366,682, approximately $223 per square foot. 275 N Sylmar Ave is a home located in Fresno County with nearby schools including Easterby Elementary School, Kings Canyon Middle School, and Sunnyside High School.
Create a Home Valuation Report for This Property
The Home Valuation Report is an in-depth analysis detailing your home's value as well as a comparison with similar homes in the area
Home Values in the Area
Average Home Value in this Area
Tax History Compared to Growth
Tax History
| Year | Tax Paid | Tax Assessment Tax Assessment Total Assessment is a certain percentage of the fair market value that is determined by local assessors to be the total taxable value of land and additions on the property. | Land | Improvement |
|---|---|---|---|---|
| 2025 | $1,754 | $146,280 | $26,614 | $119,666 |
| 2023 | $1,754 | $140,602 | $25,582 | $115,020 |
| 2022 | $1,694 | $137,846 | $25,081 | $112,765 |
| 2021 | $1,646 | $135,144 | $24,590 | $110,554 |
| 2020 | $1,638 | $133,759 | $24,338 | $109,421 |
| 2019 | $1,574 | $131,137 | $23,861 | $107,276 |
| 2018 | $1,538 | $128,567 | $23,394 | $105,173 |
| 2017 | $1,510 | $126,047 | $22,936 | $103,111 |
| 2016 | $1,459 | $123,577 | $22,487 | $101,090 |
| 2015 | $1,436 | $121,722 | $22,150 | $99,572 |
| 2014 | $1,405 | $119,339 | $21,717 | $97,622 |
Source: Public Records
Map
Nearby Homes
- 4983 E Grant Ave
- 5160 E Balch Ave
- 4918 E Illinois Ave
- 4923 E Grant Ave
- 5407 E Tulare St
- 342 N Minnewawa Ave
- 5026 E Lewis Ave
- 605 N Winery Ave
- 851 N Filbert Ave
- 5145 E Lane Ave Unit 252
- 5181 E Olive Ave Unit 117
- 5009 E Clay Ave
- 1221 N Peach Ave Unit 226
- 5527 E Grant Ave
- 5023 E Lane Ave
- 225 S Dearing Ave
- 1336 N Homsy Ave
- 1234 Address Unavailable
- 5490 E 9 Ave
- 1353 N Adler Ave
- 265 N Sylmar Ave
- 285 N Sylmar Ave
- 255 N Sylmar Ave
- 5166 E Nevada Ave
- 5165 E Nevada Ave
- 5163 E Ball Ave
- 5172 E Nevada Ave
- 5173 E Nevada Ave
- 5169 E Ball Ave
- 235 N Sylmar Ave
- 5178 E Nevada Ave
- 5179 E Nevada Ave
- 5175 E Ball Ave
- 5154 E Washington Ave
- 225 N Sylmar Ave
- 5162 E Ball Ave
- 5184 E Nevada Ave
- 5185 E Nevada Ave
- 5166 E Washington Ave
- 5181 E Ball Ave