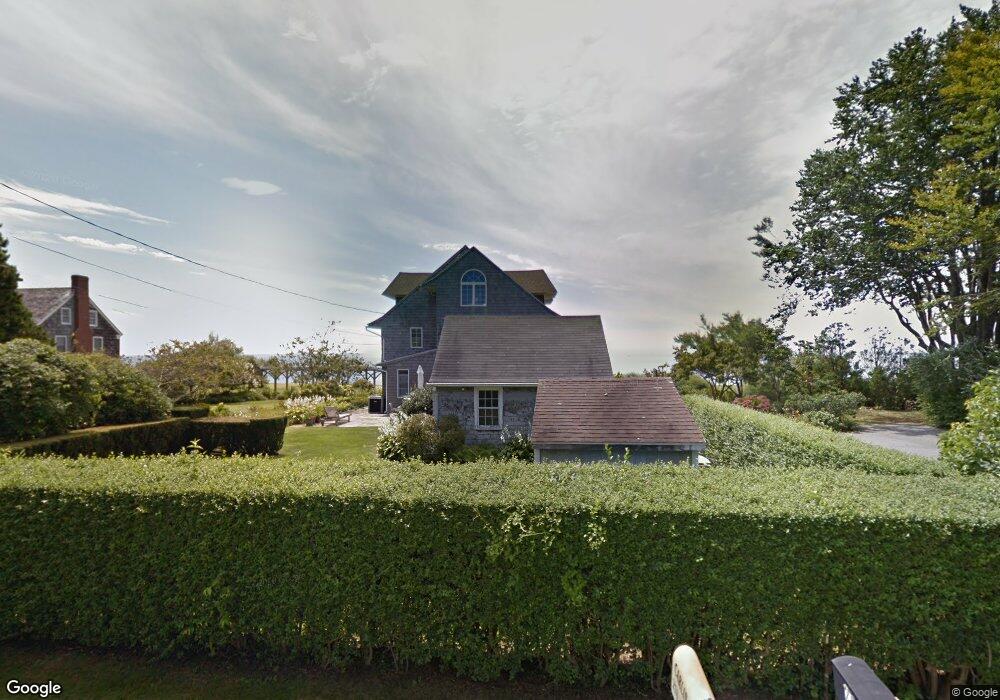
275 Old Black Point Rd Niantic, CT 06357
Estimated Value: $3,221,394 - $3,940,000
3
Beds
4
Baths
4,633
Sq Ft
$748/Sq Ft
Est. Value
About This Home
This home is located at 275 Old Black Point Rd, Niantic, CT 06357 and is currently estimated at $3,465,849, approximately $748 per square foot. 275 Old Black Point Rd is a home located in New London County with nearby schools including East Lyme Middle School, East Lyme High School, and The Light House Voc-Ed Center.
Ownership History
Date
Name
Owned For
Owner Type
Purchase Details
Closed on
Jul 31, 2025
Sold by
Amdur Miriam F
Bought by
Amdur Miriam F and Amdur Henry S
Current Estimated Value
Purchase Details
Closed on
May 15, 1991
Sold by
Elliott Geoffrey and Elliott Faye
Bought by
Amdur Henry and Amdur Miriam
Home Financials for this Owner
Home Financials are based on the most recent Mortgage that was taken out on this home.
Original Mortgage
$500,000
Interest Rate
9.4%
Mortgage Type
Unknown
Create a Home Valuation Report for This Property
The Home Valuation Report is an in-depth analysis detailing your home's value as well as a comparison with similar homes in the area
Home Values in the Area
Average Home Value in this Area
Purchase History
| Date | Buyer | Sale Price | Title Company |
|---|---|---|---|
| Amdur Miriam F | -- | -- | |
| Amdur Henry | $820,000 | -- | |
| Amdur Henry | $820,000 | -- |
Source: Public Records
Mortgage History
| Date | Status | Borrower | Loan Amount |
|---|---|---|---|
| Previous Owner | Amdur Henry | $485,000 | |
| Previous Owner | Amdur Henry | $500,000 | |
| Previous Owner | Amdur Henry | $500,000 |
Source: Public Records
Tax History Compared to Growth
Tax History
| Year | Tax Paid | Tax Assessment Tax Assessment Total Assessment is a certain percentage of the fair market value that is determined by local assessors to be the total taxable value of land and additions on the property. | Land | Improvement |
|---|---|---|---|---|
| 2025 | $45,804 | $1,635,270 | $1,152,830 | $482,440 |
| 2024 | $43,089 | $1,635,270 | $1,152,830 | $482,440 |
| 2023 | $40,686 | $1,635,270 | $1,152,830 | $482,440 |
| 2022 | $38,985 | $1,635,270 | $1,152,830 | $482,440 |
| 2021 | $41,586 | $1,458,660 | $1,152,830 | $305,830 |
| 2020 | $41,102 | $1,449,280 | $1,152,830 | $296,450 |
| 2019 | $40,855 | $1,449,280 | $1,152,830 | $296,450 |
| 2018 | $39,638 | $1,449,280 | $1,152,830 | $296,450 |
| 2017 | $37,913 | $1,449,280 | $1,152,830 | $296,450 |
| 2016 | $42,120 | $1,660,890 | $1,330,140 | $330,750 |
| 2015 | $41,041 | $1,660,890 | $1,330,140 | $330,750 |
| 2014 | $39,911 | $1,660,890 | $1,330,140 | $330,750 |
Source: Public Records
Map
Nearby Homes
- 11 Sunset Ave
- 4 Nehantic Dr
- 19 E Shore Dr
- 35 Bellaire Rd
- 15 Griswold Rd
- 245 Giants Neck Rd
- 22 Shore Rd
- 94 Old Black Point Rd
- 7 Old Black Point Rd
- 150 Black Point Rd
- 146 Black Point Rd
- 127 Black Point Rd Unit 11
- 76 S Edgewood Rd
- 69 Terrace Ave
- 99 Spring Glen Rd
- 68-70 Black Point Rd
- 20 Spinnaker Dr
- 3 Sunnieside Dr
- 49 Ridgewood Rd
- 78 Corey Ln Unit 9
- 277 Old Black Point Rd
- 273 Old Black Point Rd
- 274 Old Black Point Rd
- 276 Old Black Point Rd
- 279 Old Black Point Rd
- 272 Old Black Point Rd
- 269 Old Black Point Rd
- 278 Old Black Point Rd
- 13 Hemingway Rd
- 281 Old Black Point Rd
- 268 Old Black Point Rd
- 11 Hemingway Rd
- 280 Old Black Point Rd
- 267 Old Black Point Rd
- 9 Hemingway Rd
- 283 Old Black Point Rd
- 262 Old Black Point Rd
- 9 Mosle Ln
- 284 Old Black Point Rd
- 18 Hemingway Rd