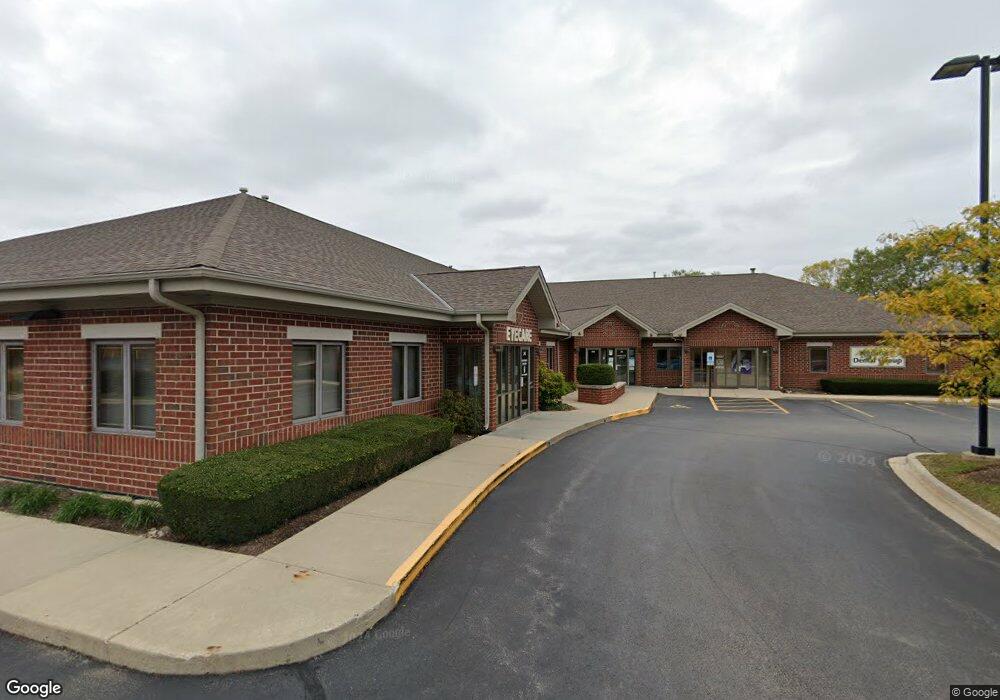
275 Stonegate Rd Algonquin, IL 60102
Estimated Value: $672,407
Studio
--
Bath
2,923
Sq Ft
$230/Sq Ft
Est. Value
About This Home
This home is located at 275 Stonegate Rd, Algonquin, IL 60102 and is currently estimated at $672,407, approximately $230 per square foot. 275 Stonegate Rd is a home located in McHenry County with nearby schools including Westfield Community School, Lincoln Prairie Elementary School, and Harry D Jacobs High School.
Ownership History
Date
Name
Owned For
Owner Type
Purchase Details
Closed on
Aug 24, 2021
Sold by
Aml Partners Llc
Bought by
275 Stonegatge Llc
Current Estimated Value
Home Financials for this Owner
Home Financials are based on the most recent Mortgage that was taken out on this home.
Original Mortgage
$420,000
Outstanding Balance
$380,753
Interest Rate
2.7%
Mortgage Type
Commercial
Estimated Equity
$291,654
Purchase Details
Closed on
Jan 17, 2019
Sold by
Dickman Fred and Dickman Mary
Bought by
Aml Partners Llc
Home Financials for this Owner
Home Financials are based on the most recent Mortgage that was taken out on this home.
Original Mortgage
$328,000
Interest Rate
4.7%
Mortgage Type
Commercial
Purchase Details
Closed on
Feb 10, 2006
Sold by
Stonegate Office Llc
Bought by
Dickman Fred and Dickman Mary
Home Financials for this Owner
Home Financials are based on the most recent Mortgage that was taken out on this home.
Original Mortgage
$600,000
Interest Rate
7%
Mortgage Type
Commercial
Create a Home Valuation Report for This Property
The Home Valuation Report is an in-depth analysis detailing your home's value as well as a comparison with similar homes in the area
Purchase History
| Date | Buyer | Sale Price | Title Company |
|---|---|---|---|
| 275 Stonegatge Llc | $525,000 | First American Title | |
| Aml Partners Llc | $443,000 | Heritage Title Co | |
| Dickman Fred | $1,000,000 | Chicago Title |
Source: Public Records
Mortgage History
| Date | Status | Borrower | Loan Amount |
|---|---|---|---|
| Open | 275 Stonegatge Llc | $420,000 | |
| Previous Owner | Aml Partners Llc | $328,000 | |
| Previous Owner | Dickman Fred | $600,000 |
Source: Public Records
Tax History
| Year | Tax Paid | Tax Assessment Tax Assessment Total Assessment is a certain percentage of the fair market value that is determined by local assessors to be the total taxable value of land and additions on the property. | Land | Improvement |
|---|---|---|---|---|
| 2024 | $11,176 | $142,872 | $28,574 | $114,298 |
| 2023 | $16,238 | $193,981 | $57,499 | $136,482 |
| 2022 | $15,014 | $175,073 | $51,894 | $123,179 |
| 2021 | $14,472 | $163,101 | $48,345 | $114,756 |
| 2020 | $14,127 | $157,328 | $46,634 | $110,694 |
| 2019 | $13,827 | $150,582 | $44,634 | $105,948 |
| 2018 | $13,259 | $139,105 | $41,232 | $97,873 |
| 2017 | $13,050 | $131,046 | $38,843 | $92,203 |
| 2016 | $12,925 | $122,909 | $36,431 | $86,478 |
| 2013 | -- | $103,737 | $33,985 | $69,752 |
Source: Public Records
Map
Nearby Homes
- 145 S Oakleaf Rd
- 101 Oakleaf Rd
- 1920 Jester Ln
- 113 Pheasant Trail
- 14 Wander Way
- 7 Falcon Ridge Ct
- 2380 Dawson Ln Unit 165
- 135 Arquilla Dr
- 681 Majestic Dr
- 601 Woods Creek Ln
- 760 Regal Ln
- 74 Harvest Gate
- 1157 Sawmill Ln
- 700 Fairfield Ln
- 1820 Crofton Dr
- 1431 Essex St
- 305 Harvest Gate
- 432 Thunder Ridge
- 1354 Essex St Unit 2
- 187 Hilltop Dr
- 265 Stonegate Rd Unit 105
- 265 Stonegate Rd
- 300 Stonegate Rd
- 270 Stonegate Rd
- 260 Stonegate Rd
- 260 Stonegate Rd
- 2 Rochester Ct
- 4 Rochester Ct Unit 1
- 5 Rochester Ct
- 3 Rochester Ct Unit 1
- 8 Cardiff Ct
- 1 Rochester Ct
- 6 Cardiff Ct
- 210 Salford Dr Unit 1
- 60 S Oakleaf Rd
- 4 Cardiff Ct
- 7 Cardiff Ct
- 200 Salford Dr
- 50 S Oakleaf Rd
- 2 Cardiff Ct Unit 1
Your Personal Tour Guide
Ask me questions while you tour the home.