

2750 Nortonville Rd Franklin, IL 62638
Estimated payment $534/month
About This Lot
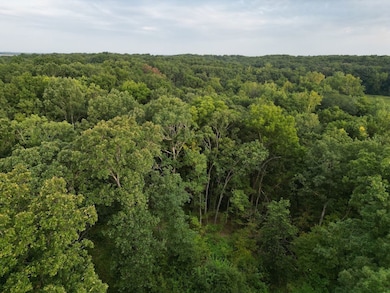
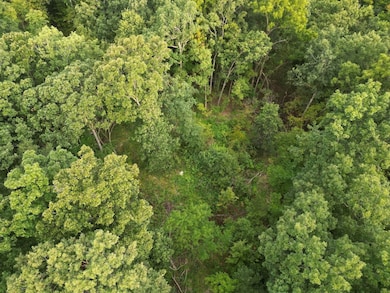
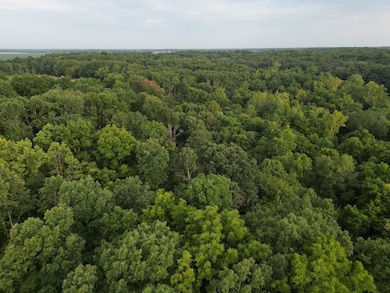
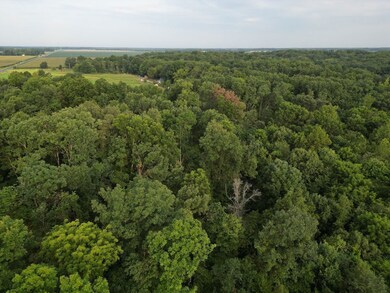
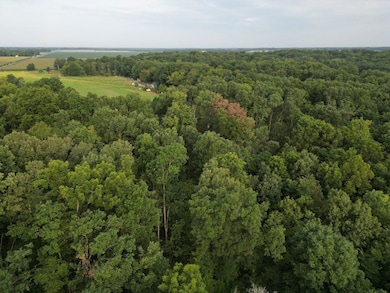
Have you been looking for an affordable tract of land that offers great recreational activities? This 8-acre parcel in Morgan County is ready for a new owner. Nortonville Rd provides access on the south. You enter on the ridgetop and can follow the high, or drop down into the creek bottom, depending on the wind or time of year you are hunting. This area of the county has always had great genetics and a good number of deer. this property is all timber and holds deer throughout the year. There is a small dry run creek that serves as the eastern border. This sand-bottomed creek provides an extremely quiet access to the entire property. This property is also a perfect site for a cabin or home. Power and rural water are along the county road, and the homesite would give great visuals down into the creek bottom. Small parcels like this one don't come around very often, especially ones that can provide great hunting as well as a building site. Please call today for a private tour.

Property Details
Property Type
- Land
Lot Details
- Current uses include hunting/fishing, timber
Map
Home Values in the Area
Average Home Value in this Area
Tax History
| Year | Tax Paid | Tax Assessment Tax Assessment Total Assessment is a certain percentage of the fair market value that is determined by local assessors to be the total taxable value of land and additions on the property. | Land | Improvement |
|---|---|---|---|---|
| 2024 | $1,363 | $27,090 | $8,950 | $18,140 |
| 2023 | $1,195 | $25,970 | $8,180 | $17,790 |
| 2022 | $1,551 | $25,280 | $7,490 | $17,790 |
| 2021 | $1,497 | $25,620 | $6,880 | $18,740 |
| 2020 | $1,667 | $25,370 | $6,330 | $19,040 |
| 2019 | $1,143 | $16,990 | $5,790 | $11,200 |
| 2018 | $1,167 | $16,160 | $5,270 | $10,890 |
| 2017 | $1,027 | $15,510 | $4,820 | $10,690 |
| 2016 | $981 | $14,680 | $4,380 | $10,300 |
| 2015 | $993 | $14,330 | $4,030 | $10,300 |
| 2014 | $993 | $13,840 | $3,730 | $10,110 |
| 2013 | $967 | $13,670 | $3,560 | $10,110 |
Property History
| Date | Event | Price | List to Sale | Price per Sq Ft |
|---|---|---|---|---|
| 11/24/2025 11/24/25 | Pending | -- | -- | -- |
| 09/16/2025 09/16/25 | For Sale | $80,000 | -- | -- |
Purchase History
| Date | Type | Sale Price | Title Company |
|---|---|---|---|
| Interfamily Deed Transfer | -- | None Available |
- 0 Crow Rd Unit Lot WP001 23042120
- 2158 Langdon Rd
- 110 Wyatt St
- 306 E Prairie St
- Lots 2-4 Barton St
- 101 Cottage Ln
- 1940 Midway Rd
- 32624 Route 111
- 112 Lonergan Ln
- 367 Ayers St
- 150 E Tanner St
- 248 E Vandalia St
- 121 E Tremont St
- 109 Adele Ct
- 2552 Loami Rd
- 2538 Loami Rd
- 1100 Heritage Dr
- 1249 Woods Ln
- 34831 Greenland Rd
- 1106 E Vandalia Rd
- 200 Labor Dr
- 1116 E Morton Ave
- 800 Illinois Ave
- 813 Freedman St
- 326 Sycamore St
- 1830 Prairie Vista Dr
- 1419 Redwood Dr
- 4601 Ash Grove Dr
- 2628 Stratford Dr
- 4621 Eugene Ct
- 2300 Boysenberry Ln
- 2235 S Koke Mill Rd
- 3111 Elmhurst Dr Unit 1
- 3309 Telford Dr
- 2218 Concord Ct
- 4305 W Washington St
- 9 Candlelight Dr
- 1833 Seven Pines Rd
- 3150 Cobblestone Ln
- 1615 Westchester Blvd