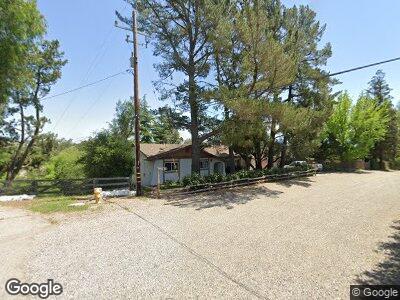
2750 Stow Los Olivos, CA 93441
Los Olivos NeighborhoodEstimated Value: $1,481,000 - $1,889,000
3
Beds
2
Baths
1,727
Sq Ft
$936/Sq Ft
Est. Value
About This Home
This home is located at 2750 Stow, Los Olivos, CA 93441 and is currently estimated at $1,615,874, approximately $935 per square foot. 2750 Stow is a home located in Santa Barbara County with nearby schools including Los Olivos Elementary School, Santa Ynez Valley Union High School, and Santa Ynez Valley Charter School.
Ownership History
Date
Name
Owned For
Owner Type
Purchase Details
Closed on
Jan 26, 2021
Sold by
Deane Heidi Huglin
Bought by
Deane Heidi Huglin and Heidi Huglin Deane Trust
Current Estimated Value
Purchase Details
Closed on
May 12, 2003
Sold by
Deane Andrew M and Huglin Heidi
Bought by
Deane Andrew M and Huglin Deane Heidi
Home Financials for this Owner
Home Financials are based on the most recent Mortgage that was taken out on this home.
Original Mortgage
$246,500
Outstanding Balance
$113,757
Interest Rate
5.71%
Estimated Equity
$1,457,532
Purchase Details
Closed on
Apr 29, 1996
Sold by
Wood Michael A and Gimlin Denise A
Bought by
Huglin Deane Andrew M and Huglin Deane Heidi
Home Financials for this Owner
Home Financials are based on the most recent Mortgage that was taken out on this home.
Original Mortgage
$204,000
Interest Rate
7.82%
Create a Home Valuation Report for This Property
The Home Valuation Report is an in-depth analysis detailing your home's value as well as a comparison with similar homes in the area
Home Values in the Area
Average Home Value in this Area
Purchase History
| Date | Buyer | Sale Price | Title Company |
|---|---|---|---|
| Deane Heidi Huglin | -- | None Available | |
| Deane Andrew M | -- | First American Title Co | |
| Huglin Deane Andrew M | $255,000 | Continental Lawyers Title Co |
Source: Public Records
Mortgage History
| Date | Status | Borrower | Loan Amount |
|---|---|---|---|
| Closed | Deane Andrew M | $130,000 | |
| Closed | Deane Andrew M | $20,000 | |
| Open | Deane Andrew M | $246,500 | |
| Closed | Deane Andrew M | $10,000 | |
| Closed | Deane Andrew M | $241,000 | |
| Closed | Deane Andrew M | $75,000 | |
| Closed | Huglin Deane Andrew M | $204,000 |
Source: Public Records
Tax History Compared to Growth
Tax History
| Year | Tax Paid | Tax Assessment Tax Assessment Total Assessment is a certain percentage of the fair market value that is determined by local assessors to be the total taxable value of land and additions on the property. | Land | Improvement |
|---|---|---|---|---|
| 2023 | $5,151 | $407,149 | $215,550 | $191,599 |
| 2022 | $4,960 | $399,167 | $211,324 | $187,843 |
| 2021 | $4,806 | $391,341 | $207,181 | $184,160 |
| 2020 | $4,730 | $387,329 | $205,057 | $182,272 |
| 2019 | $4,640 | $379,736 | $201,037 | $178,699 |
| 2018 | $4,557 | $372,292 | $197,096 | $175,196 |
| 2017 | $3,997 | $364,993 | $193,232 | $171,761 |
| 2016 | $3,877 | $357,838 | $189,444 | $168,394 |
| 2014 | $3,643 | $345,560 | $182,944 | $162,616 |
Source: Public Records
Map
Nearby Homes