Estimated Value: $163,000 - $241,000
3
Beds
1
Bath
1,080
Sq Ft
$186/Sq Ft
Est. Value
About This Home
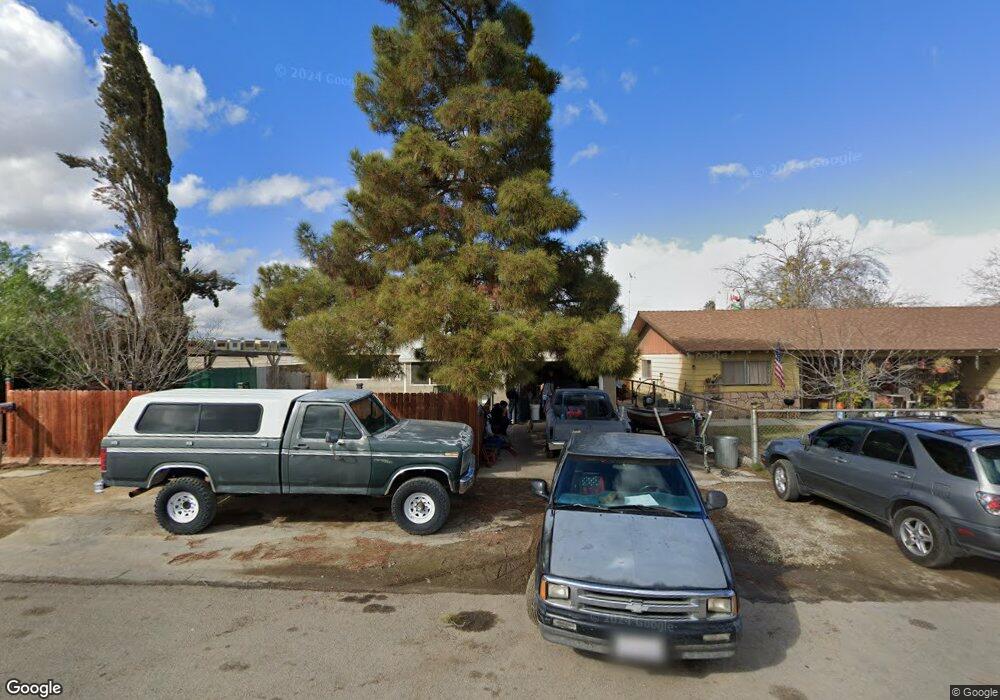
This home is located at 27502 Pine St, Taft, CA 93268 and is currently estimated at $200,597, approximately $185 per square foot. 27502 Pine St is a home located in Kern County with nearby schools including Roosevelt Elementary School, Conley Elementary School, and Lincoln Junior High School.
Ownership History
Date
Name
Owned For
Owner Type
Purchase Details
Closed on
Jun 18, 2019
Sold by
Ramirez Lawrence
Bought by
Ramirez Lawewnce and Ramirez Daniel
Current Estimated Value
Purchase Details
Closed on
Dec 12, 2001
Sold by
Bank Of New York
Bought by
Ramirez Lawrence
Home Financials for this Owner
Home Financials are based on the most recent Mortgage that was taken out on this home.
Original Mortgage
$48,242
Interest Rate
7.17%
Mortgage Type
Seller Take Back
Purchase Details
Closed on
May 11, 2001
Sold by
Sell Sherman and Sell Alisa
Bought by
Countrywide Home Loans Inc
Purchase Details
Closed on
Oct 7, 1998
Sold by
Geiger Joe L and Geiger Deanna S
Bought by
Sell Sherman and Sell Alisa
Home Financials for this Owner
Home Financials are based on the most recent Mortgage that was taken out on this home.
Original Mortgage
$50,400
Interest Rate
6.86%
Create a Home Valuation Report for This Property
The Home Valuation Report is an in-depth analysis detailing your home's value as well as a comparison with similar homes in the area
Home Values in the Area
Average Home Value in this Area
Purchase History
| Date | Buyer | Sale Price | Title Company |
|---|---|---|---|
| Ramirez Lawewnce | -- | None Available | |
| Ramirez Lawrence | $49,000 | First American Title Co | |
| Countrywide Home Loans Inc | $46,750 | First American Title Co | |
| Sell Sherman | $63,000 | First American Title Co |
Source: Public Records
Mortgage History
| Date | Status | Borrower | Loan Amount |
|---|---|---|---|
| Previous Owner | Ramirez Lawrence | $48,242 | |
| Previous Owner | Sell Sherman | $50,400 | |
| Closed | Sell Sherman | $10,710 |
Source: Public Records
Tax History Compared to Growth
Tax History
| Year | Tax Paid | Tax Assessment Tax Assessment Total Assessment is a certain percentage of the fair market value that is determined by local assessors to be the total taxable value of land and additions on the property. | Land | Improvement |
|---|---|---|---|---|
| 2025 | $1,490 | $72,368 | $26,583 | $45,785 |
| 2024 | $1,490 | $70,950 | $26,062 | $44,888 |
| 2023 | $1,320 | $69,559 | $25,551 | $44,008 |
| 2022 | $1,176 | $68,196 | $25,050 | $43,146 |
| 2021 | $1,109 | $66,859 | $24,559 | $42,300 |
| 2020 | $1,021 | $66,175 | $24,308 | $41,867 |
| 2019 | $989 | $66,175 | $24,308 | $41,867 |
| 2018 | $944 | $63,608 | $23,365 | $40,243 |
| 2017 | $916 | $62,361 | $22,907 | $39,454 |
| 2016 | $956 | $61,139 | $22,458 | $38,681 |
| 2015 | $894 | $60,221 | $22,121 | $38,100 |
| 2014 | $617 | $37,000 | $9,250 | $27,750 |
Source: Public Records
Map
Nearby Homes
- 27568 Highway 119
- 27564 Maple St
- 27573 Cypress St
- 27579 Tamarisk Rd
- 27947 California 119
- 28102 Valley West Rd
- 28102 Valley Rd W
- 28103 Palomino Ave
- 28108 Valley West Rd
- 28108 Valley Rd W
- 28106 Highway 119
- 28149 Chaparral Ave
- 28173 Chaparral Ave
- 28109 Sunridge Ave
- 28115 Sunridge Ave
- 28178 Cosworth Ave
- 3907102 Taft
- 0 Ave V Vic 96th Unit SW25187142
- 0 Ave V Vic 96th Unit 202509439
- 2345 Terra Bella
- 27504 Pine St
- 27510 Pine St
- 27507 Pine St
- 27516 Pine St
- 27518 Pine St
- 27515 Pine St
- 27501 Valley West Rd
- 27501 Valley Rd W
- 27507 Valley West Rd
- 27507 Valley Rd W
- 27513 Valley West Rd
- 27520 Pine St
- 0 Pine St
- 26017 Orange St
- 27523 Valley West Rd
- 26010 Orange St
- 27524 Highway 119
- 26025 Orange St
- 27525 Pine St
- 27528 Highway 119