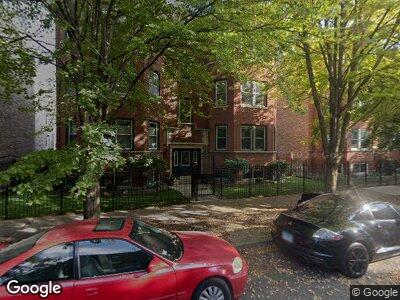
2753 N Spaulding Ave Unit 1N Chicago, IL 60647
Logan Square NeighborhoodEstimated Value: $433,000 - $478,723
2
Beds
2
Baths
11,612
Sq Ft
$40/Sq Ft
Est. Value
About This Home
This home is located at 2753 N Spaulding Ave Unit 1N, Chicago, IL 60647 and is currently estimated at $463,181, approximately $39 per square foot. 2753 N Spaulding Ave Unit 1N is a home located in Cook County with nearby schools including Avondale-Logandale Elementary School, Schurz High School, and Aspira Business & Finance High School.
Ownership History
Date
Name
Owned For
Owner Type
Purchase Details
Closed on
Aug 10, 2024
Sold by
Young Alyson J
Bought by
Mulvaney William J and Garcia-Son Noemi
Current Estimated Value
Home Financials for this Owner
Home Financials are based on the most recent Mortgage that was taken out on this home.
Original Mortgage
$381,600
Outstanding Balance
$381,258
Interest Rate
6.55%
Mortgage Type
New Conventional
Purchase Details
Closed on
May 9, 2016
Sold by
Stalec Paul
Bought by
Young Alyson J
Home Financials for this Owner
Home Financials are based on the most recent Mortgage that was taken out on this home.
Original Mortgage
$263,920
Interest Rate
3.75%
Mortgage Type
New Conventional
Purchase Details
Closed on
Jul 9, 2009
Sold by
Davis Roy and Davis Shana
Bought by
Stalec Paul
Home Financials for this Owner
Home Financials are based on the most recent Mortgage that was taken out on this home.
Original Mortgage
$208,000
Interest Rate
5.62%
Mortgage Type
Purchase Money Mortgage
Purchase Details
Closed on
Mar 17, 2006
Sold by
Davis Shana and Davis Roy
Bought by
Davis Shana and Davis Roy
Home Financials for this Owner
Home Financials are based on the most recent Mortgage that was taken out on this home.
Original Mortgage
$220,500
Interest Rate
1%
Mortgage Type
Negative Amortization
Purchase Details
Closed on
Jul 30, 2003
Sold by
Davis Roy
Bought by
Sanders Shana
Home Financials for this Owner
Home Financials are based on the most recent Mortgage that was taken out on this home.
Original Mortgage
$34,100
Interest Rate
5.62%
Mortgage Type
Unknown
Purchase Details
Closed on
Jun 10, 2002
Sold by
Paunescu Calin
Bought by
Monola James M
Home Financials for this Owner
Home Financials are based on the most recent Mortgage that was taken out on this home.
Original Mortgage
$223,000
Interest Rate
6.8%
Mortgage Type
Purchase Money Mortgage
Purchase Details
Closed on
May 10, 2002
Sold by
Manola James M
Bought by
Davis Roy
Home Financials for this Owner
Home Financials are based on the most recent Mortgage that was taken out on this home.
Original Mortgage
$223,000
Interest Rate
6.8%
Mortgage Type
Purchase Money Mortgage
Purchase Details
Closed on
Feb 18, 2000
Sold by
Paunescu Calin
Bought by
Manola James M
Home Financials for this Owner
Home Financials are based on the most recent Mortgage that was taken out on this home.
Original Mortgage
$155,700
Interest Rate
8%
Create a Home Valuation Report for This Property
The Home Valuation Report is an in-depth analysis detailing your home's value as well as a comparison with similar homes in the area
Home Values in the Area
Average Home Value in this Area
Purchase History
| Date | Buyer | Sale Price | Title Company |
|---|---|---|---|
| Mulvaney William J | $477,000 | None Listed On Document | |
| Young Alyson J | $330,000 | Proper Title Llc | |
| Stalec Paul | $260,000 | Chicago Title Ins Co | |
| Davis Shana | -- | Ticor Title Ins Co 2002 | |
| Sanders Shana | $228,000 | -- | |
| Davis Roy | $230,000 | Ticor Title Insurance Co | |
| Manola James M | $173,000 | -- |
Source: Public Records
Mortgage History
| Date | Status | Borrower | Loan Amount |
|---|---|---|---|
| Open | Mulvaney William J | $381,600 | |
| Previous Owner | Young Alyson J | $263,920 | |
| Previous Owner | Stalec Paul | $208,000 | |
| Previous Owner | Stalec Paul | $208,000 | |
| Previous Owner | Stalec Paul | $26,000 | |
| Previous Owner | Davis Shana | $220,500 | |
| Previous Owner | Sanders Shana | $34,100 | |
| Previous Owner | Sanders Shana | $182,000 | |
| Previous Owner | Davis Roy | $223,000 | |
| Previous Owner | Manola James M | $155,700 | |
| Previous Owner | Manola James M | $155,700 |
Source: Public Records
Tax History Compared to Growth
Tax History
| Year | Tax Paid | Tax Assessment Tax Assessment Total Assessment is a certain percentage of the fair market value that is determined by local assessors to be the total taxable value of land and additions on the property. | Land | Improvement |
|---|---|---|---|---|
| 2024 | $7,223 | $39,830 | $4,108 | $35,722 |
| 2023 | $7,223 | $35,000 | $3,305 | $31,695 |
| 2022 | $7,223 | $35,000 | $3,305 | $31,695 |
| 2021 | $7,061 | $34,999 | $3,304 | $31,695 |
| 2020 | $6,182 | $27,650 | $1,510 | $26,140 |
| 2019 | $6,239 | $30,943 | $1,510 | $29,433 |
| 2018 | $6,112 | $30,943 | $1,510 | $29,433 |
| 2017 | $4,915 | $22,830 | $1,321 | $21,509 |
| 2016 | $4,573 | $22,830 | $1,321 | $21,509 |
| 2015 | $4,184 | $22,830 | $1,321 | $21,509 |
| 2014 | $4,325 | $23,312 | $1,133 | $22,179 |
| 2013 | $4,240 | $23,312 | $1,133 | $22,179 |
Source: Public Records
Map
Nearby Homes
- 3308 W Diversey Ave
- 2732 N Kimball Ave Unit G
- 2542 N Kedzie Blvd Unit 109
- 2855 N Spaulding Ave
- 3426 W Wrightwood Ave
- 3100 W Diversey Ave Unit 1S
- 2554 N Bernard St
- 2836 N Dawson Ave Unit 1E
- 2646 N Whipple St
- 2848 N Albany Ave Unit 2S
- 2933 N Spaulding Ave
- 2921 N Kedzie Ave
- 2707 N Whipple St
- 2642 N Drake Ave
- 2437 N Kedzie Blvd Unit G
- 2939 N Troy St
- 2460 N Albany Ave Unit 24601
- 2707 N Central Park Ave
- 2414 N Spaulding Ave Unit 2R
- 2523 N Drake Ave
- 2753 N Spaulding Ave Unit 3
- 2753 N Spaulding Ave Unit 1N
- 2753 N Spaulding Ave Unit GS
- 2753 N Spaulding Ave Unit 2N
- 2753 N Spaulding Ave Unit GN
- 2753 N Spaulding Ave Unit 2S
- 2753 N Spaulding Ave Unit 3S
- 2753 N Spaulding Ave Unit 3N
- 2753 N Spaulding Ave Unit 1S
- 2753 N Spaulding Ave Unit 309
- 2753 N Spaulding Ave Unit 316
- 2753 N Spaulding Ave Unit 317
- 2753 N Spaulding Ave
- 2755 N Spaulding Ave Unit 2
- 2755 N Spaulding Ave Unit GN
- 2755 N Spaulding Ave Unit 2
- 2755 N Spaulding Ave Unit 1N
- 2761 N Spaulding Ave Unit 2
- 2761 N Spaulding Ave
- 2763 N Spaulding Ave Unit 1