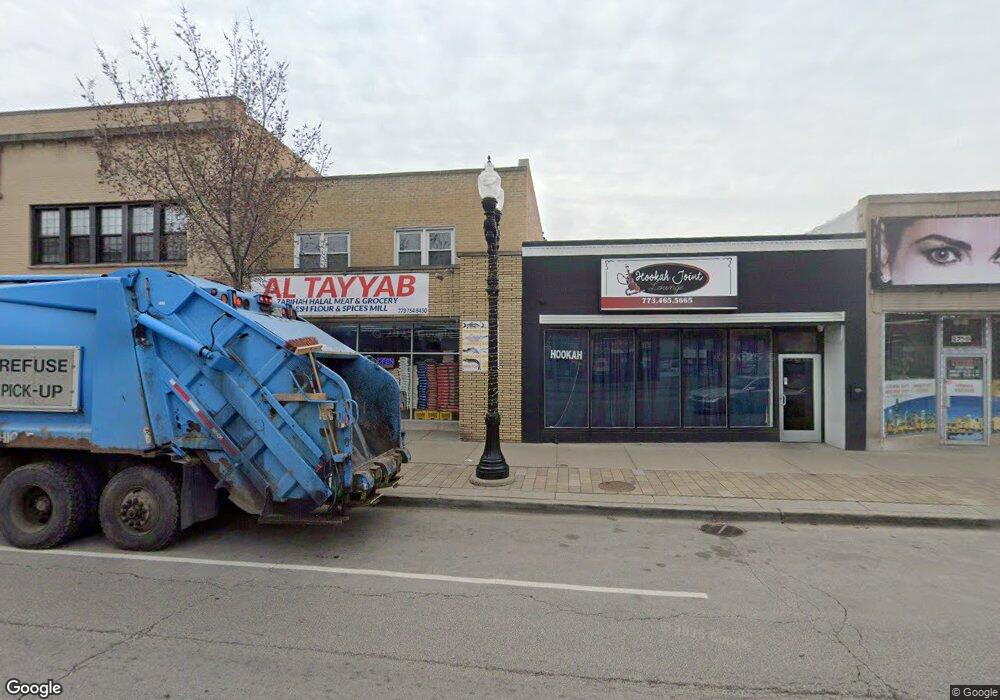
2753 W Devon Ave Chicago, IL 60659
West Ridge NeighborhoodEstimated Value: $563,926 - $712,000
2
Beds
4
Baths
4,100
Sq Ft
$152/Sq Ft
Est. Value
About This Home
This home is located at 2753 W Devon Ave, Chicago, IL 60659 and is currently estimated at $623,975, approximately $152 per square foot. 2753 W Devon Ave is a home located in Cook County with nearby schools including Clinton Elementary School, Mather High School, and Yeshivas Tiferes Tzvi Academy.
Ownership History
Date
Name
Owned For
Owner Type
Purchase Details
Closed on
Dec 20, 2012
Sold by
Ansari Uzma Faheem
Bought by
Ansari Family Irrevocable Trust
Current Estimated Value
Purchase Details
Closed on
May 31, 2012
Sold by
Ali Mohammed Y and Ali Nikhat S
Bought by
Ansari Uzma Faheem
Purchase Details
Closed on
Feb 27, 2009
Sold by
Ali Mohammed Y and Ali Nikhat S
Bought by
Ali Mohammed Y and Ali Nikhat S
Purchase Details
Closed on
Aug 4, 2004
Sold by
Devon Bank
Bought by
Iqra Intl Education Foundation Inc
Home Financials for this Owner
Home Financials are based on the most recent Mortgage that was taken out on this home.
Original Mortgage
$384,352
Interest Rate
6.35%
Mortgage Type
Seller Take Back
Purchase Details
Closed on
Nov 7, 2000
Sold by
Moy Goon Gum Fung
Bought by
Ali Nikhat S and Ali Mohammed Y
Create a Home Valuation Report for This Property
The Home Valuation Report is an in-depth analysis detailing your home's value as well as a comparison with similar homes in the area
Home Values in the Area
Average Home Value in this Area
Purchase History
| Date | Buyer | Sale Price | Title Company |
|---|---|---|---|
| Ansari Family Irrevocable Trust | -- | None Available | |
| Ansari Uzma Faheem | $205,000 | Cti | |
| Ali Mohammed Y | -- | None Available | |
| The Ali Family Trust | -- | None Available | |
| Iqra Intl Education Foundation Inc | -- | Gnt | |
| Ali Nikhat S | $275,000 | -- |
Source: Public Records
Mortgage History
| Date | Status | Borrower | Loan Amount |
|---|---|---|---|
| Previous Owner | Iqra Intl Education Foundation Inc | $384,352 |
Source: Public Records
Tax History Compared to Growth
Tax History
| Year | Tax Paid | Tax Assessment Tax Assessment Total Assessment is a certain percentage of the fair market value that is determined by local assessors to be the total taxable value of land and additions on the property. | Land | Improvement |
|---|---|---|---|---|
| 2024 | $7,407 | $47,001 | $11,563 | $35,438 |
| 2023 | $7,676 | $32,000 | $9,375 | $22,625 |
| 2022 | $7,676 | $32,000 | $9,375 | $22,625 |
| 2021 | $7,580 | $32,003 | $9,378 | $22,625 |
| 2020 | $8,261 | $31,826 | $5,625 | $26,201 |
| 2019 | $8,611 | $36,582 | $5,625 | $30,957 |
| 2018 | $8,340 | $36,582 | $5,625 | $30,957 |
| 2017 | $9,438 | $38,495 | $5,000 | $33,495 |
| 2016 | $8,751 | $38,495 | $5,000 | $33,495 |
| 2015 | $7,808 | $38,495 | $5,000 | $33,495 |
| 2014 | $7,059 | $34,460 | $4,687 | $29,773 |
| 2013 | $6,632 | $34,460 | $4,687 | $29,773 |
Source: Public Records
Map
Nearby Homes
- 6312 N Fairfield Ave Unit 3B
- 6451 N California Ave Unit 2
- 6457 N California Ave Unit 3
- 6307 N Talman Ave
- 6235 N Mozart St
- 6414 N Rockwell St
- 6418 N Rockwell St
- 6226 N Mozart St Unit 2N
- 6215 N Washtenaw Ave
- 6214 N Mozart St Unit 3E
- 6439 N Rockwell St Unit 2
- 6215 N Talman Ave
- 6508 N Richmond St Unit 1D
- 6400 N Sacramento Ave Unit 205
- 6539 N Sacramento Ave
- 6144 N Maplewood Ave
- 6212 N Sacramento Ave
- 6504 N Whipple St
- 6259 N Artesian Ave
- 6319 N Artesian Ave Unit 3W
- 2751 W Devon Ave
- 2745 W Devon Ave
- 6343 N California Ave
- 2739 W Devon Ave
- 2741 W Devon Ave
- 2735 W Devon Ave Unit 207
- 2735 W Devon Ave Unit 208
- 2735 W Devon Ave Unit 206
- 2735 W Devon Ave
- 2735 W Devon Ave Unit 505
- 2735 W Devon Ave Unit 2
- 6342 N Fairfield Ave Unit 2
- 6342 N Fairfield Ave
- 6354 N Fairfield Ave Unit 2
- 2733 W Devon Ave
- 6337 N California Ave
- 6338 N Fairfield Ave
- 6333 N California Ave
- 6333 N California Ave Unit 2ND
- 6336 N Fairfield Ave