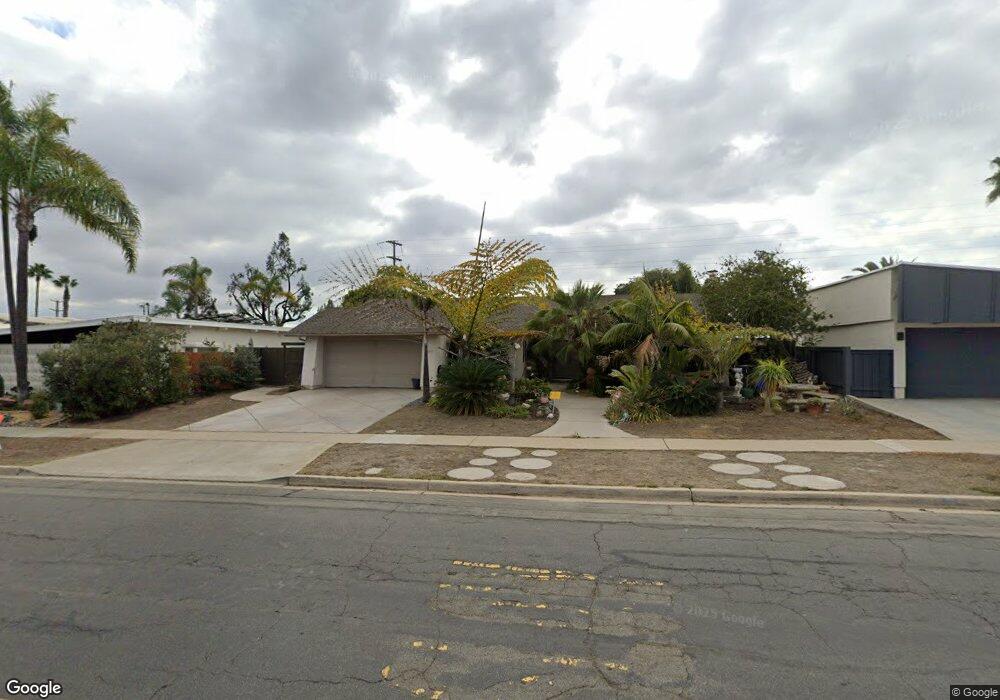
2755 Soderblom Ave San Diego, CA 92122
University City NeighborhoodEstimated Value: $1,757,014 - $1,884,000
4
Beds
2
Baths
2,332
Sq Ft
$788/Sq Ft
Est. Value
About This Home
This home is located at 2755 Soderblom Ave, San Diego, CA 92122 and is currently estimated at $1,836,754, approximately $787 per square foot. 2755 Soderblom Ave is a home located in San Diego County with nearby schools including Spreckels Elementary School, Standley Middle School, and University City High School.
Ownership History
Date
Name
Owned For
Owner Type
Purchase Details
Closed on
Aug 29, 2017
Sold by
Holter Michael J and Miller Lori R
Bought by
Holter Nichael J
Current Estimated Value
Purchase Details
Closed on
Jan 24, 2007
Sold by
Holter Michael J
Bought by
Holter Michael J and Miller Holter Lori R
Purchase Details
Closed on
Nov 2, 2005
Sold by
Miller Holter Lori
Bought by
Holter Michael J
Purchase Details
Closed on
Jun 6, 2002
Sold by
Baker Douglas L
Bought by
Holter Michael
Home Financials for this Owner
Home Financials are based on the most recent Mortgage that was taken out on this home.
Original Mortgage
$380,000
Outstanding Balance
$154,294
Interest Rate
6.25%
Estimated Equity
$1,682,460
Create a Home Valuation Report for This Property
The Home Valuation Report is an in-depth analysis detailing your home's value as well as a comparison with similar homes in the area
Home Values in the Area
Average Home Value in this Area
Purchase History
| Date | Buyer | Sale Price | Title Company |
|---|---|---|---|
| Holter Nichael J | -- | None Available | |
| Holter Micahel J | -- | None Available | |
| Holter Michael J | -- | None Available | |
| Holter Michael J | -- | -- | |
| Holter Michael | $475,000 | Fidelity National Title |
Source: Public Records
Mortgage History
| Date | Status | Borrower | Loan Amount |
|---|---|---|---|
| Open | Holter Michael | $380,000 |
Source: Public Records
Tax History Compared to Growth
Tax History
| Year | Tax Paid | Tax Assessment Tax Assessment Total Assessment is a certain percentage of the fair market value that is determined by local assessors to be the total taxable value of land and additions on the property. | Land | Improvement |
|---|---|---|---|---|
| 2025 | $9,085 | $751,659 | $376,701 | $374,958 |
| 2024 | $9,085 | $736,921 | $369,315 | $367,606 |
| 2023 | $8,885 | $722,473 | $362,074 | $360,399 |
| 2022 | $8,648 | $708,308 | $354,975 | $353,333 |
| 2021 | $8,589 | $694,420 | $348,015 | $346,405 |
| 2020 | $8,485 | $687,301 | $344,447 | $342,854 |
| 2019 | $8,334 | $673,826 | $337,694 | $336,132 |
| 2018 | $7,792 | $660,615 | $331,073 | $329,542 |
| 2017 | $81 | $647,663 | $324,582 | $323,081 |
| 2016 | $7,486 | $634,965 | $318,218 | $316,747 |
| 2015 | $7,294 | $625,429 | $313,439 | $311,990 |
| 2014 | $7,177 | $613,179 | $307,300 | $305,879 |
Source: Public Records
Map
Nearby Homes
- 5522 Bloch St
- 3003 Fried Ave
- 4793 Leathers St
- 8037 Caminito Mallorca
- 7901 Avenida Kirjah
- 4085 Rosenda Ct Unit 259
- 4095 Rosenda Ct Unit 249
- 4690 Lisann St
- 2871 Caminito Merion
- 6036 Tulane St
- 2885 Caminito Merion
- 4664 Isleta Ave
- 4654 Lisann St
- 8127 Caminito Mallorca
- 2807 Caminito Merion
- 8340 Via Sonoma Unit F
- 6013 Oakgate Row
- 5222 Gaylord Place
- 2714 Ariane Dr Unit 16
- 2941 Ariane Dr
- 2745 Soderblom Ave
- 2765 Soderblom Ave
- 5474 Bothe Ave
- 2735 Soderblom Ave
- 2775 Soderblom Ave
- 2725 Soderblom Ave
- 2787 San Clemente Terrace
- 2763 San Clemente Terrace
- 5454 Bothe Ave
- 2777 San Clemente Terrace
- 2749 San Clemente Terrace
- 2779 San Clemente Terrace
- 2735 San Clemente Terrace
- 5434 Bothe Ave
- 2715 Soderblom Ave
- 5505 Stresemann St
- 5489 Bothe Ave
- 2707 San Clemente Terrace
- 5475 Bothe Ave
- 5414 Bothe Ave