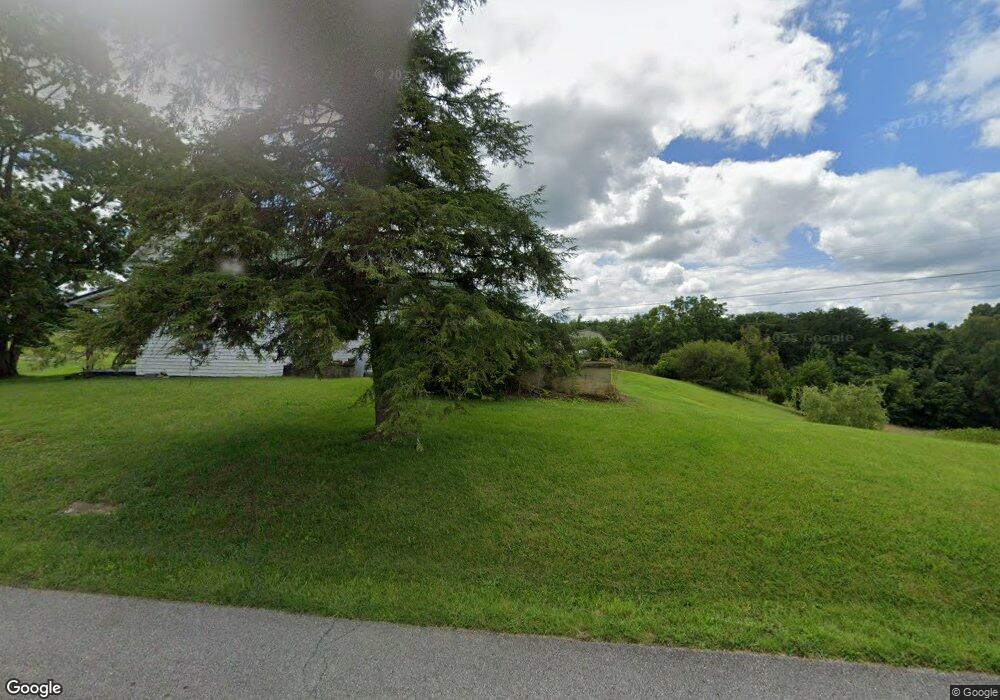
2755 Weems Chapel Rd Mosheim, TN 37818
Estimated Value: $120,845 - $181,000
--
Bed
1
Bath
1,642
Sq Ft
$96/Sq Ft
Est. Value
About This Home
This home is located at 2755 Weems Chapel Rd, Mosheim, TN 37818 and is currently estimated at $157,461, approximately $95 per square foot. 2755 Weems Chapel Rd is a home located in Greene County with nearby schools including Mosheim Elementary School, West Greene Middle Schools, and West Greene High School.
Ownership History
Date
Name
Owned For
Owner Type
Purchase Details
Closed on
Oct 11, 2019
Sold by
Maxwell Norman G
Bought by
Walker Rick and Walker Anita
Current Estimated Value
Purchase Details
Closed on
Nov 8, 2016
Sold by
Krystal Maxwell
Bought by
Maxwell Norman G and Maxwell Norman G
Purchase Details
Closed on
Aug 18, 2015
Sold by
Gray Fred E Estate
Bought by
Maxwell Crystal and Maxwell Norman G Revocable Tru
Purchase Details
Closed on
May 28, 2014
Sold by
Smith William
Bought by
Gray Fred
Purchase Details
Closed on
Feb 9, 2005
Sold by
Citifinancial Mortgage Com
Bought by
Smith William
Purchase Details
Closed on
Oct 4, 2004
Sold by
Palmer Christopher L
Bought by
Citifinancial Mortgage Company
Purchase Details
Closed on
Nov 4, 1992
Bought by
Harrell Edward Dale Lisa A
Purchase Details
Closed on
Aug 7, 1992
Bought by
Williams Boles Robert H B L
Purchase Details
Closed on
Dec 11, 1990
Bought by
Causey Homer Nancy
Create a Home Valuation Report for This Property
The Home Valuation Report is an in-depth analysis detailing your home's value as well as a comparison with similar homes in the area
Home Values in the Area
Average Home Value in this Area
Purchase History
| Date | Buyer | Sale Price | Title Company |
|---|---|---|---|
| Walker Rick | $18,000 | None Available | |
| Maxwell Norman G | -- | -- | |
| Maxwell Crystal | $12,000 | -- | |
| Gray Fred | $10,000 | -- | |
| Smith William | $26,500 | -- | |
| Citifinancial Mortgage Company | $50,500 | -- | |
| Harrell Edward Dale Lisa A | $27,000 | -- | |
| Williams Boles Robert H B L | $60,000 | -- | |
| Causey Homer Nancy | $30,000 | -- |
Source: Public Records
Tax History Compared to Growth
Tax History
| Year | Tax Paid | Tax Assessment Tax Assessment Total Assessment is a certain percentage of the fair market value that is determined by local assessors to be the total taxable value of land and additions on the property. | Land | Improvement |
|---|---|---|---|---|
| 2024 | $452 | $27,400 | $4,000 | $23,400 |
| 2023 | $384 | $23,275 | $0 | $0 |
| 2022 | $23,000 | $11,425 | $2,950 | $8,475 |
| 2021 | $230 | $11,425 | $2,950 | $8,475 |
| 2020 | $230 | $11,425 | $2,950 | $8,475 |
| 2019 | $230 | $11,425 | $2,950 | $8,475 |
| 2018 | $243 | $12,050 | $2,950 | $9,100 |
| 2017 | $184 | $9,300 | $2,950 | $6,350 |
| 2016 | $174 | $9,300 | $2,950 | $6,350 |
| 2015 | $174 | $9,300 | $2,950 | $6,350 |
| 2014 | $174 | $9,300 | $2,950 | $6,350 |
Source: Public Records
Map
Nearby Homes
- 335 Carpenters Chapel Rd
- 0 Marvin Rd Unit 1276985
- Tbd Hogan Ln
- 995 Gilbreath Mill Rd
- Tbd Bertie Patton Rd
- 0 Gap Creek Rd Unit 22620366
- 0 Gap Creek Rd Unit 1288379
- 0 Gap Creek Rd Unit 9975568
- 704 Weems Chapel Rd
- 1ac Mccullough Ln
- 1370 Iron Bridge Rd
- 2440 Mount Carmel Rd
- 0 Mohawk Ridge Rd Unit 1307547
- 1 Mohawk Ridge Rd
- 1983 Oasis Rd
- 1365 Mohawk Ridge Rd
- 40 Iron Bridge Rd
- 1444 Mount Carmel Rd
- 240 Guthries Greene Rd
- 0 Wilkerson Rd Unit 22678949
- 2800 Weems Chapel Rd
- 2880 Weems Chapel Rd
- 455575 Gilbreath Loop
- 2685 Gilbreath Rd
- 97 Humbert Ln
- 147 Humbert Ln
- 2980 Weems Chapel Rd
- 290 Humbert Ln
- 107 Humbert Ln
- 300 Humbert Ln
- 2544 Weems Chapel Rd
- 2855 Gilbreath Rd
- 75 Gilbreath Loop
- 75 Gilbreath Loop
- 2790 Gilbreath Rd
- 2335 Gilbreath Rd
- 2660 Gilbreath Rd
- 65 Gilbreath Loop
- 45 Gilbreath Loop
- 45 Gilbreath Loop