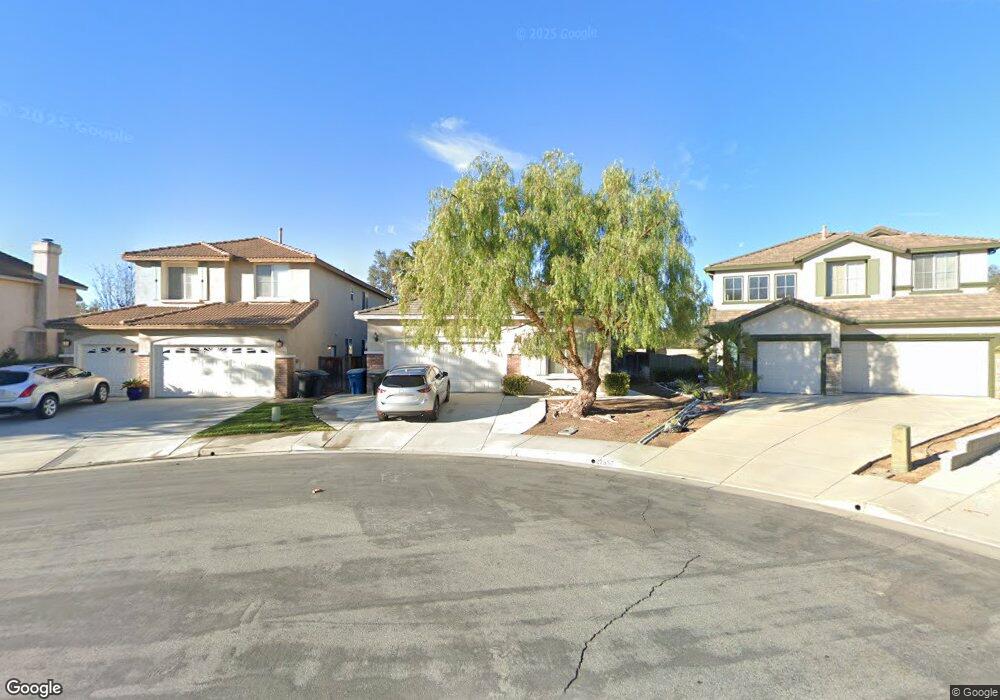
27567 Campana Cir Temecula, CA 92591
Meadowview NeighborhoodEstimated Value: $629,173 - $645,000
4
Beds
2
Baths
1,513
Sq Ft
$423/Sq Ft
Est. Value
About This Home
This home is located at 27567 Campana Cir, Temecula, CA 92591 and is currently estimated at $639,293, approximately $422 per square foot. 27567 Campana Cir is a home located in Riverside County with nearby schools including Nicolas Valley Elementary School, James L. Day Middle School, and Chaparral High School.
Ownership History
Date
Name
Owned For
Owner Type
Purchase Details
Closed on
Mar 10, 2003
Sold by
Smith G J
Bought by
Smith Devi T
Current Estimated Value
Home Financials for this Owner
Home Financials are based on the most recent Mortgage that was taken out on this home.
Original Mortgage
$216,000
Outstanding Balance
$80,611
Interest Rate
4.08%
Mortgage Type
Negative Amortization
Estimated Equity
$558,682
Purchase Details
Closed on
Feb 8, 2001
Sold by
Smith Yvonne
Bought by
Smith G J C
Home Financials for this Owner
Home Financials are based on the most recent Mortgage that was taken out on this home.
Original Mortgage
$162,000
Interest Rate
8.87%
Purchase Details
Closed on
Dec 20, 2000
Sold by
Woodside Chantemar Inc
Bought by
Smith Devi T and Smith G
Home Financials for this Owner
Home Financials are based on the most recent Mortgage that was taken out on this home.
Original Mortgage
$162,000
Interest Rate
8.87%
Create a Home Valuation Report for This Property
The Home Valuation Report is an in-depth analysis detailing your home's value as well as a comparison with similar homes in the area
Home Values in the Area
Average Home Value in this Area
Purchase History
We collect this data history from publicly available records. To have your information removed, we recommend requesting removal directly through your county’s website.
| Date | Buyer | Sale Price | Title Company |
|---|---|---|---|
| Smith Devi T | -- | New Century Title Company | |
| Smith G J C | -- | First American Title Co | |
| Smith Devi T | $203,000 | First American Title Co |
Source: Public Records
Mortgage History
We collect this data history from publicly available records. To have your information removed, we recommend requesting removal directly through your county’s website.
| Date | Status | Borrower | Loan Amount |
|---|---|---|---|
| Open | Smith Devi T | $216,000 | |
| Previous Owner | Smith Devi T | $162,000 | |
| Closed | Smith Devi T | $40,500 |
Source: Public Records
Tax History
| Year | Tax Paid | Tax Assessment Tax Assessment Total Assessment is a certain percentage of the fair market value that is determined by local assessors to be the total taxable value of land and additions on the property. | Land | Improvement |
|---|---|---|---|---|
| 2025 | $4,503 | $355,306 | $95,590 | $259,716 |
| 2023 | $4,503 | $341,511 | $91,879 | $249,632 |
| 2022 | $4,363 | $334,816 | $90,078 | $244,738 |
| 2021 | $4,273 | $328,252 | $88,312 | $239,940 |
| 2020 | $4,226 | $324,887 | $87,407 | $237,480 |
| 2019 | $4,165 | $318,518 | $85,694 | $232,824 |
| 2018 | $4,083 | $312,273 | $84,014 | $228,259 |
| 2017 | $4,011 | $306,151 | $82,367 | $223,784 |
| 2016 | $3,937 | $300,149 | $80,752 | $219,397 |
| 2015 | $3,869 | $295,642 | $79,540 | $216,102 |
| 2014 | $3,757 | $289,853 | $77,983 | $211,870 |
Source: Public Records
Map
Nearby Homes
- 27568 Campana Cir
- 27570 Nellie Ct
- 40243 Mimulus Way
- 40183 Mimulus Way
- 40166 Valeriana Ct
- 27440 Bolandra Ct
- 28939 Davenport Ln
- 29017 Savannah Dr
- 29001 Savannah Dr
- 29118 Portland Ct
- 40780 Carmelita Cir
- 40238 Ayer Ln
- 29763 Dawncrest Cir
- 40122 Stowe Rd
- 39875 Knollridge Dr
- 28882 Lakefront Rd
- 40341 Trenton Ct
- 30175 Corte Coelho
- 39823 Knollridge Dr
- 39549 June Rd
- 27557 Campana Cir
- 27577 Campana Cir
- 27587 Campana Cir
- 27547 Campana Cir
- 27597 Campana Cir
- 27548 Campana Cir
- 27558 Campana Cir
- 27578 Campana Cir
- 40445 Chantemar Way
- 27598 Campana Cir
- 40453 Chantemar Way
- 27545 Nellie Ct
- 27535 Nellie Ct
- 27555 Nellie Ct
- 27565 Nellie Ct
- 27575 Nellie Ct
- 27525 Nellie Ct
- 40461 Chantemar Way
- 40426 Chantemar Way
- 40410 Chantemar Way
Your Personal Tour Guide
Ask me questions while you tour the home.