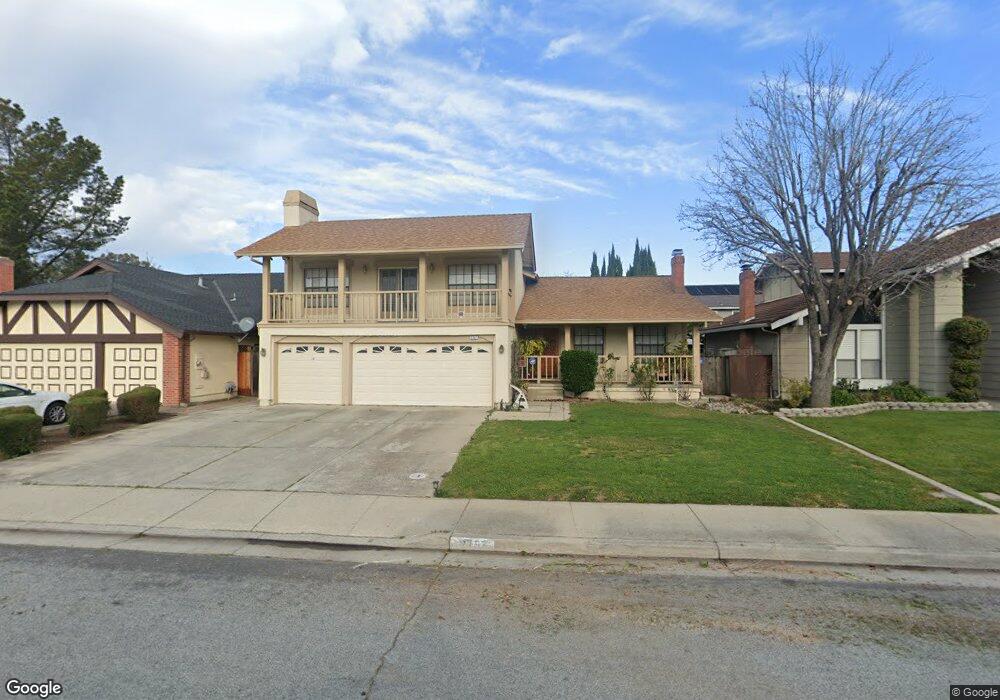
2757 Glauser Dr San Jose, CA 95133
Penitencia NeighborhoodEstimated Value: $1,867,919 - $2,074,000
4
Beds
3
Baths
2,400
Sq Ft
$819/Sq Ft
Est. Value
About This Home
This home is located at 2757 Glauser Dr, San Jose, CA 95133 and is currently estimated at $1,966,230, approximately $819 per square foot. 2757 Glauser Dr is a home located in Santa Clara County with nearby schools including Summerdale Elementary School, Piedmont Middle School, and Independence High School.
Ownership History
Date
Name
Owned For
Owner Type
Purchase Details
Closed on
Sep 15, 2009
Sold by
Ly Xuong Chi and Ly Cindy Suiy
Bought by
Ly Xuong Chi and Ly Cindy Suiy
Current Estimated Value
Purchase Details
Closed on
Dec 1, 1999
Sold by
Nguyen My Thi T
Bought by
Ly Xuong Chi and Ly Cindy Suiy
Purchase Details
Closed on
Sep 27, 1999
Sold by
Nguyen Hoan B
Bought by
Nguyen My Thi Thanh
Home Financials for this Owner
Home Financials are based on the most recent Mortgage that was taken out on this home.
Original Mortgage
$100,000
Interest Rate
7.97%
Mortgage Type
Credit Line Revolving
Purchase Details
Closed on
Jun 20, 1997
Sold by
Hoge Thanh V
Bought by
Nguyen Hoan Boi and Nguyen My Thi Thanh
Home Financials for this Owner
Home Financials are based on the most recent Mortgage that was taken out on this home.
Original Mortgage
$239,000
Interest Rate
7.91%
Purchase Details
Closed on
May 10, 1996
Sold by
Vanhoge Thanh
Bought by
Vanhoge Thanh
Create a Home Valuation Report for This Property
The Home Valuation Report is an in-depth analysis detailing your home's value as well as a comparison with similar homes in the area
Home Values in the Area
Average Home Value in this Area
Purchase History
| Date | Buyer | Sale Price | Title Company |
|---|---|---|---|
| Ly Xuong Chi | -- | None Available | |
| Ly Xuong Chi | $500,000 | Chicago Title Co | |
| Nguyen My Thi Thanh | -- | Chicago Title | |
| Nguyen Hoan Boi | $389,000 | Fidelity National Title Co | |
| Vanhoge Thanh | -- | -- |
Source: Public Records
Mortgage History
| Date | Status | Borrower | Loan Amount |
|---|---|---|---|
| Previous Owner | Nguyen My Thi Thanh | $100,000 | |
| Previous Owner | Nguyen Hoan Boi | $239,000 |
Source: Public Records
Tax History Compared to Growth
Tax History
| Year | Tax Paid | Tax Assessment Tax Assessment Total Assessment is a certain percentage of the fair market value that is determined by local assessors to be the total taxable value of land and additions on the property. | Land | Improvement |
|---|---|---|---|---|
| 2025 | $10,873 | $768,469 | $307,388 | $461,081 |
| 2024 | $10,873 | $753,402 | $301,361 | $452,041 |
| 2023 | $10,676 | $738,630 | $295,452 | $443,178 |
| 2022 | $10,632 | $724,148 | $289,659 | $434,489 |
| 2021 | $10,366 | $709,950 | $283,980 | $425,970 |
| 2020 | $10,047 | $702,672 | $281,069 | $421,603 |
| 2019 | $9,665 | $688,895 | $275,558 | $413,337 |
| 2018 | $9,527 | $675,388 | $270,155 | $405,233 |
| 2017 | $9,584 | $662,146 | $264,858 | $397,288 |
| 2016 | $9,186 | $649,164 | $259,665 | $389,499 |
| 2015 | $9,079 | $639,414 | $255,765 | $383,649 |
| 2014 | $8,356 | $626,889 | $250,755 | $376,134 |
Source: Public Records
Map
Nearby Homes
- 2806 Glauser Dr
- 2714 Mabury Square
- 825 N Capitol Ave Unit 4
- 994 Harcot Ct
- 981 Harcot Ct
- 982 Harcot Ct
- 997 Harcot Ct
- 998 Harcot Ct
- 714 N Capitol Ave
- 931 ToMcOt Ct
- 990 Harcot Ct
- 970 E Harcot Ct
- Residence 2 Plan at Ascend
- Residence 1 Plan at Ascend
- Residence 3 Plan at Ascend
- 1055 N Capitol Ave Unit 124
- 1055 N Capitol Ave Unit 180
- 1055 N Capitol Ave Unit 51
- 674 Galleon Ct
- 693 Kirk Glen Dr
- 2761 Glauser Dr
- 2753 Glauser Dr
- 2758 Eversole Dr
- 2762 Eversole Dr
- 2754 Eversole Dr
- 2765 Glauser Dr
- 2756 Glauser Dr
- 2766 Eversole Dr
- 2760 Glauser Dr
- 2752 Glauser Dr
- 2769 Glauser Dr
- 2764 Glauser Dr
- 851 Clearview Dr
- 2770 Eversole Dr
- 845 Clearview Dr
- 857 Clearview Dr
- 839 Clearview Dr
- 2768 Glauser Dr
- 863 Clearview Dr
- 2773 Glauser Dr