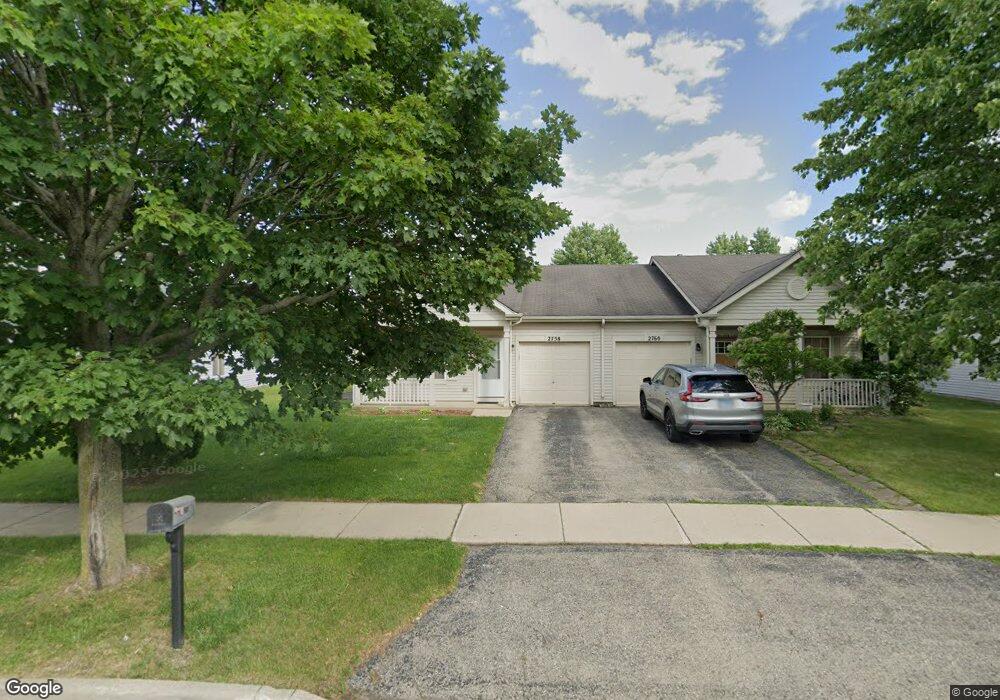
2758 Cedar Glade Rd Naperville, IL 60564
Wood Lake NeighborhoodEstimated Value: $299,000 - $326,000
--
Bed
--
Bath
934
Sq Ft
$329/Sq Ft
Est. Value
About This Home
This home is located at 2758 Cedar Glade Rd, Naperville, IL 60564 and is currently estimated at $307,506, approximately $329 per square foot. 2758 Cedar Glade Rd is a home located in Will County with nearby schools including Welch Elementary School, Scullen Middle School, and Neuqua Valley High School.
Ownership History
Date
Name
Owned For
Owner Type
Purchase Details
Closed on
Mar 18, 2002
Sold by
Hud
Bought by
Mccumber Brian S
Current Estimated Value
Home Financials for this Owner
Home Financials are based on the most recent Mortgage that was taken out on this home.
Original Mortgage
$117,131
Interest Rate
7.07%
Mortgage Type
FHA
Purchase Details
Closed on
Nov 26, 2001
Sold by
Peterson Chris J and Countrywide Home Loans Inc
Bought by
Hud
Purchase Details
Closed on
Oct 18, 2001
Sold by
Peterson J Chris and Woodlake Homeowners Assn
Bought by
Countrywide Home Loans Inc
Purchase Details
Closed on
Mar 17, 1998
Sold by
Woodlake Ltd Partnership
Bought by
Peterson J Chris
Home Financials for this Owner
Home Financials are based on the most recent Mortgage that was taken out on this home.
Original Mortgage
$106,186
Interest Rate
7.27%
Mortgage Type
FHA
Create a Home Valuation Report for This Property
The Home Valuation Report is an in-depth analysis detailing your home's value as well as a comparison with similar homes in the area
Home Values in the Area
Average Home Value in this Area
Purchase History
| Date | Buyer | Sale Price | Title Company |
|---|---|---|---|
| Mccumber Brian S | -- | -- | |
| Hud | -- | Wheatland Title | |
| Countrywide Home Loans Inc | $143,938 | -- | |
| Peterson J Chris | $108,500 | Chicago Title Insurance Co |
Source: Public Records
Mortgage History
| Date | Status | Borrower | Loan Amount |
|---|---|---|---|
| Previous Owner | Mccumber Brian S | $117,131 | |
| Previous Owner | Peterson J Chris | $106,186 |
Source: Public Records
Tax History Compared to Growth
Tax History
| Year | Tax Paid | Tax Assessment Tax Assessment Total Assessment is a certain percentage of the fair market value that is determined by local assessors to be the total taxable value of land and additions on the property. | Land | Improvement |
|---|---|---|---|---|
| 2024 | $4,424 | $75,538 | $29,956 | $45,582 |
| 2023 | $4,424 | $66,730 | $26,463 | $40,267 |
| 2022 | $3,842 | $59,030 | $25,034 | $33,996 |
| 2021 | $3,658 | $56,219 | $23,842 | $32,377 |
| 2020 | $3,584 | $55,328 | $23,464 | $31,864 |
| 2019 | $3,514 | $53,769 | $22,803 | $30,966 |
| 2018 | $3,302 | $50,076 | $22,302 | $27,774 |
| 2017 | $3,243 | $48,783 | $21,726 | $27,057 |
| 2016 | $3,230 | $47,733 | $21,258 | $26,475 |
| 2015 | $3,596 | $45,897 | $20,440 | $25,457 |
| 2014 | $3,596 | $48,995 | $20,440 | $28,555 |
| 2013 | $3,596 | $48,995 | $20,440 | $28,555 |
Source: Public Records
Map
Nearby Homes
- 2809 Alameda Ct
- 2611 Cedar Glade Dr Unit 204
- 2611 Cedar Glade Dr Unit 201
- 2545 Eldorado Ln
- 2866 Stonewater Dr Unit 102
- 2503 Sheehan Dr Unit 104
- 2806 Vernal Ln
- 2124 Leverenz Rd
- 2207 Sisters Ave
- 3310 Rosecroft Ln
- 3349 Rosecroft Ln Unit 2
- 10S506 Whittington Ln
- 2220 Waterleaf Ct Unit 204
- 2819 Rutland Cir Unit 102
- 2247 Palmer Cir
- 2219 Waterleaf Ct Unit 203
- 2211 Skylane Dr
- 2255 Palmer Cir
- 2211 Waterleaf Ct Unit 204
- 3592 Scottsdale Cir
- 2760 Cedar Glade Rd Unit 3
- 2754 Cedar Glade Rd
- 2764 Cedar Glade Rd
- 2752 Cedar Glade Rd Unit 3
- 2729 Idaho Rd
- 2727 Idaho Rd
- 2766 Cedar Glade Dr
- 2593 Warm Springs Ln
- 2766 Cedar Glade Rd
- 2748 Cedar Glade Rd Unit 3
- 2591 Warm Springs Ln
- 2723 Idaho Rd
- 2589 Warm Springs Ln
- 2746 Cedar Glade Rd
- 2721 Idaho Rd
- 2757 Cedar Glade Rd Unit 276
- 2753 Cedar Glade Rd
- 2587 Warm Springs Ln
- 2751 Cedar Glade Rd
- 2751 Cedar Glade Rd Unit 1