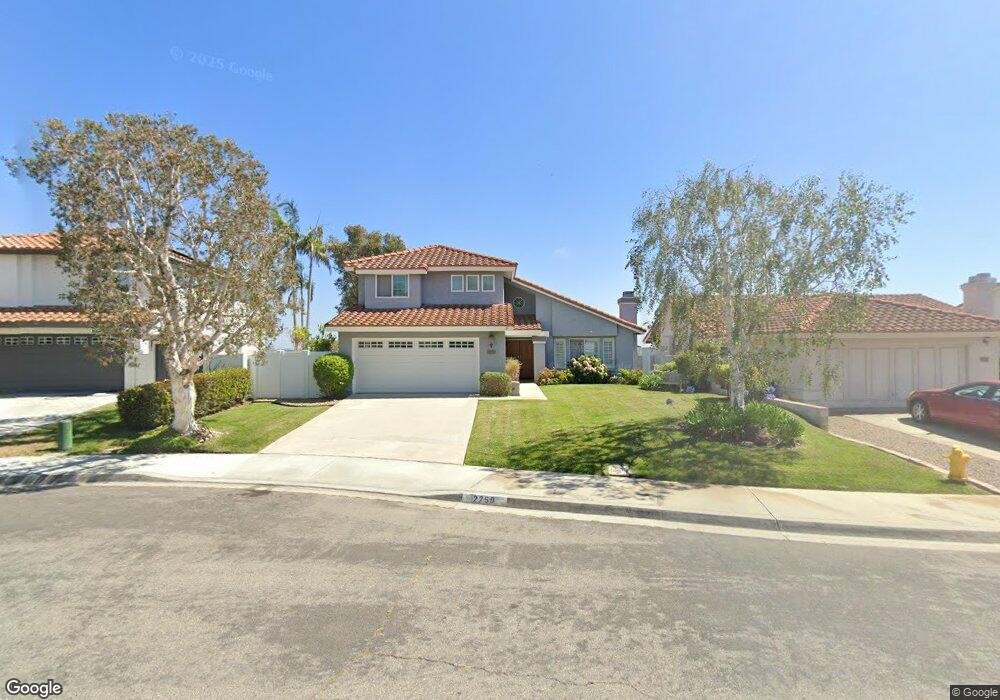
2759 Tiburon Ave Carlsbad, CA 92010
Tamarack Point NeighborhoodEstimated Value: $1,367,845 - $1,489,000
3
Beds
3
Baths
1,855
Sq Ft
$772/Sq Ft
Est. Value
About This Home
This home is located at 2759 Tiburon Ave, Carlsbad, CA 92010 and is currently estimated at $1,431,711, approximately $771 per square foot. 2759 Tiburon Ave is a home located in San Diego County with nearby schools including Hope Elementary School, Calavera Hills Middle, and Carlsbad High School.
Ownership History
Date
Name
Owned For
Owner Type
Purchase Details
Closed on
Aug 19, 2014
Sold by
Silvox Madeline and Silcox Philip
Bought by
Silcox Philip and Silcox Madeline
Current Estimated Value
Purchase Details
Closed on
Mar 7, 2013
Sold by
The Madeline Silcox Separate Property Tr and Silcox Madeline
Bought by
Silcox Madeline and Silcox Philip
Home Financials for this Owner
Home Financials are based on the most recent Mortgage that was taken out on this home.
Original Mortgage
$225,000
Outstanding Balance
$44,194
Interest Rate
2.74%
Mortgage Type
New Conventional
Estimated Equity
$1,387,517
Purchase Details
Closed on
May 20, 2008
Sold by
Silcox Madeline
Bought by
Madeline Silcox Separate Property Trust and Silcox Madeline
Purchase Details
Closed on
Jul 19, 1991
Bought by
Silcox Philip L Madeline
Purchase Details
Closed on
Feb 9, 1988
Create a Home Valuation Report for This Property
The Home Valuation Report is an in-depth analysis detailing your home's value as well as a comparison with similar homes in the area
Home Values in the Area
Average Home Value in this Area
Purchase History
| Date | Buyer | Sale Price | Title Company |
|---|---|---|---|
| Silcox Philip | -- | None Available | |
| Silcox Madeline | -- | Wfg Title | |
| Madeline Silcox Separate Property Trust | -- | None Available | |
| Silcox Madeline | -- | None Available | |
| Silcox Philip L Madeline | $296,500 | -- | |
| -- | $220,000 | -- |
Source: Public Records
Mortgage History
| Date | Status | Borrower | Loan Amount |
|---|---|---|---|
| Open | Silcox Madeline | $225,000 |
Source: Public Records
Tax History Compared to Growth
Tax History
| Year | Tax Paid | Tax Assessment Tax Assessment Total Assessment is a certain percentage of the fair market value that is determined by local assessors to be the total taxable value of land and additions on the property. | Land | Improvement |
|---|---|---|---|---|
| 2025 | $5,455 | $524,290 | $247,557 | $276,733 |
| 2024 | $5,455 | $514,010 | $242,703 | $271,307 |
| 2023 | $5,426 | $503,933 | $237,945 | $265,988 |
| 2022 | $5,341 | $494,053 | $233,280 | $260,773 |
| 2021 | $5,299 | $484,366 | $228,706 | $255,660 |
| 2020 | $5,263 | $479,400 | $226,361 | $253,039 |
| 2019 | $5,167 | $470,001 | $221,923 | $248,078 |
| 2018 | $4,948 | $460,786 | $217,572 | $243,214 |
| 2017 | $92 | $451,752 | $213,306 | $238,446 |
| 2016 | $4,668 | $442,895 | $209,124 | $233,771 |
| 2015 | $4,649 | $436,243 | $205,983 | $230,260 |
| 2014 | $4,570 | $427,699 | $201,949 | $225,750 |
Source: Public Records
Map
Nearby Homes
- 4375 Stanford St
- 4583 Chancery Ct
- 4459 Dorchester Place
- 4350 Point Reyes Ct
- 2754 Inverness Dr
- 4439 Salisbury Dr
- 2591 Regent Rd Unit 52
- 2543 Glasgow Dr
- 2880 Englewood Way
- 4405 Sierra Morena Ave
- 4847 Nelson Ct
- 4590 Salem Place
- 3485 Corvallis St
- 2992 Lexington Cir
- 4427 Trieste Dr
- 2935 Cliff Cir Unit 33
- 2572 Chamomile Ln
- Plan 2212 Modeled at Coral Springs
- 4654 Catmint Ln
- 4600 Catmint Ln
- 2755 Tiburon Ave
- 2761 Tiburon Ave
- 2751 Tiburon Ave
- 4398 Stanford St
- 2747 Tiburon Ave
- 4378 Tuolumne Place
- 4394 Stanford St
- 2743 Tiburon Ave
- 4610 Trafalgar Ln Unit 3
- 4390 Stanford St
- 4611 Buckingham Ln Unit 3
- 4374 Tuolumne Place Unit 2
- 2739 Tiburon Ave
- 4613 Buckingham Ln
- 4612 Buckingham Ln Unit 3
- 4608 Trafalgar Ln
- 4377 Tuolumne Place
- 4615 Buckingham Ln
- 4386 Stanford St
- 4614 Buckingham Ln