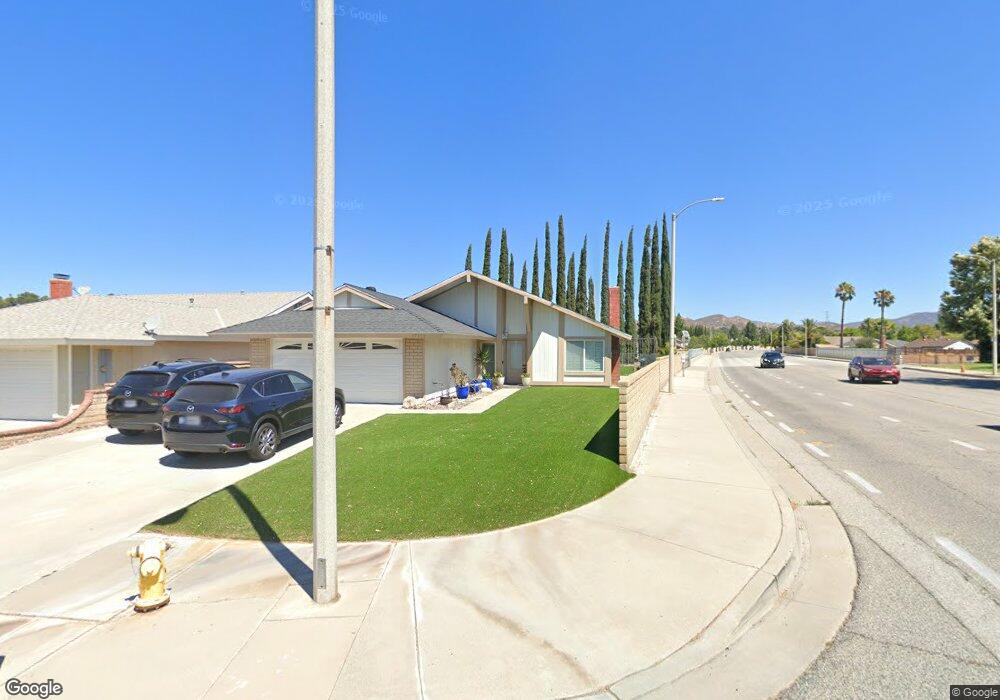
27599 Falling Star Ln Santa Clarita, CA 91350
Saugus NeighborhoodEstimated Value: $734,036 - $775,000
4
Beds
2
Baths
1,400
Sq Ft
$538/Sq Ft
Est. Value
About This Home
This home is located at 27599 Falling Star Ln, Santa Clarita, CA 91350 and is currently estimated at $752,509, approximately $537 per square foot. 27599 Falling Star Ln is a home located in Los Angeles County with nearby schools including Highlands Elementary School, Arroyo Seco Junior High School, and Saugus High School.
Ownership History
Date
Name
Owned For
Owner Type
Purchase Details
Closed on
Mar 22, 2012
Sold by
Entrust Administration Trust
Bought by
Scm Ventures Llc
Current Estimated Value
Purchase Details
Closed on
May 4, 2011
Sold by
Nobriga Ada P
Bought by
Entrust Administration Trust and Louis R Fricke Roth Ira #36527La
Purchase Details
Closed on
Nov 8, 2007
Sold by
Nobriga Ada P
Bought by
Nobriga Ada P and Ada P Nobriga Trust
Purchase Details
Closed on
Jul 9, 2007
Sold by
Nobriga Ada P and The Ada P Nobriga Trust
Bought by
Nobriga Ada P
Home Financials for this Owner
Home Financials are based on the most recent Mortgage that was taken out on this home.
Original Mortgage
$346,500
Interest Rate
6.5%
Mortgage Type
New Conventional
Purchase Details
Closed on
Dec 10, 2004
Sold by
Nobriga Ada
Bought by
Nobriga Ada P and Ada P Nobriga Trust
Purchase Details
Closed on
Nov 19, 2001
Sold by
Nobriga Paul J
Bought by
Nobriga Ada
Create a Home Valuation Report for This Property
The Home Valuation Report is an in-depth analysis detailing your home's value as well as a comparison with similar homes in the area
Home Values in the Area
Average Home Value in this Area
Purchase History
| Date | Buyer | Sale Price | Title Company |
|---|---|---|---|
| Scm Ventures Llc | -- | Title Company | |
| Entrust Administration Trust | $230,404 | None Available | |
| Nobriga Ada P | -- | None Available | |
| Nobriga Ada P | -- | Chicago Title Co | |
| Nobriga Ada P | -- | -- | |
| Nobriga Ada | -- | -- |
Source: Public Records
Mortgage History
| Date | Status | Borrower | Loan Amount |
|---|---|---|---|
| Previous Owner | Nobriga Ada P | $346,500 |
Source: Public Records
Tax History Compared to Growth
Tax History
| Year | Tax Paid | Tax Assessment Tax Assessment Total Assessment is a certain percentage of the fair market value that is determined by local assessors to be the total taxable value of land and additions on the property. | Land | Improvement |
|---|---|---|---|---|
| 2025 | $4,420 | $294,659 | $96,082 | $198,577 |
| 2024 | $4,420 | $288,883 | $94,199 | $194,684 |
| 2023 | $4,282 | $283,219 | $92,352 | $190,867 |
| 2022 | $4,295 | $277,667 | $90,542 | $187,125 |
| 2021 | $4,222 | $272,223 | $88,767 | $183,456 |
| 2020 | $4,182 | $269,432 | $87,857 | $181,575 |
| 2019 | $4,078 | $264,150 | $86,135 | $178,015 |
| 2018 | $3,923 | $258,972 | $84,447 | $174,525 |
| 2016 | $3,695 | $248,918 | $81,169 | $167,749 |
| 2015 | $3,558 | $245,180 | $79,950 | $165,230 |
| 2014 | $3,502 | $240,378 | $78,384 | $161,994 |
Source: Public Records
Map
Nearby Homes
- 21560 Quinn Place
- 27620 Susan Beth Way Unit A
- 27547 Saffron Ln
- 27502 Caraway Ln
- 21827 Centurion Way
- 21643 Masterson Ct
- 21929 Peppercorn Dr
- 21983 Centurion Way
- 27641 Sutters Pointe Dr
- 27610 Kevin Place
- 21123 Avenida de Sonrisa
- 22003 Caceras St
- 28123 Bobwhite Cir Unit 104
- 28050 Devon Ln
- 27215 Elias Ave
- 27828 Parkvale Dr
- 20906 Susan Carole Dr
- 27619 Ron Ridge Dr
- 21741 Jeffers Ln
- 20825 Red Sky Ct
- 27597 Falling Star Ln
- 27593 Falling Star Ln
- 27589 Falling Star Ln
- 27594 Falling Star Ln
- 27585 Falling Star Ln
- 27586 Falling Star Ln
- 27580 Falling Star Ln
- 27579 Falling Star Ln
- 27646 Caraway Ln
- 27650 Caraway Ln
- 27640 Caraway Ln
- 27656 Caraway Ln
- 27636 Caraway Ln
- 27574 Falling Star Ln
- 27660 Haskell Canyon Rd Unit E
- 27664 Haskell Canyon Rd Unit L
- 27664 Haskell Canyon Rd Unit K
- 27664 Haskell Canyon Rd Unit J
- 27664 Haskell Canyon Rd Unit I
- 27664 Haskell Canyon Rd Unit H