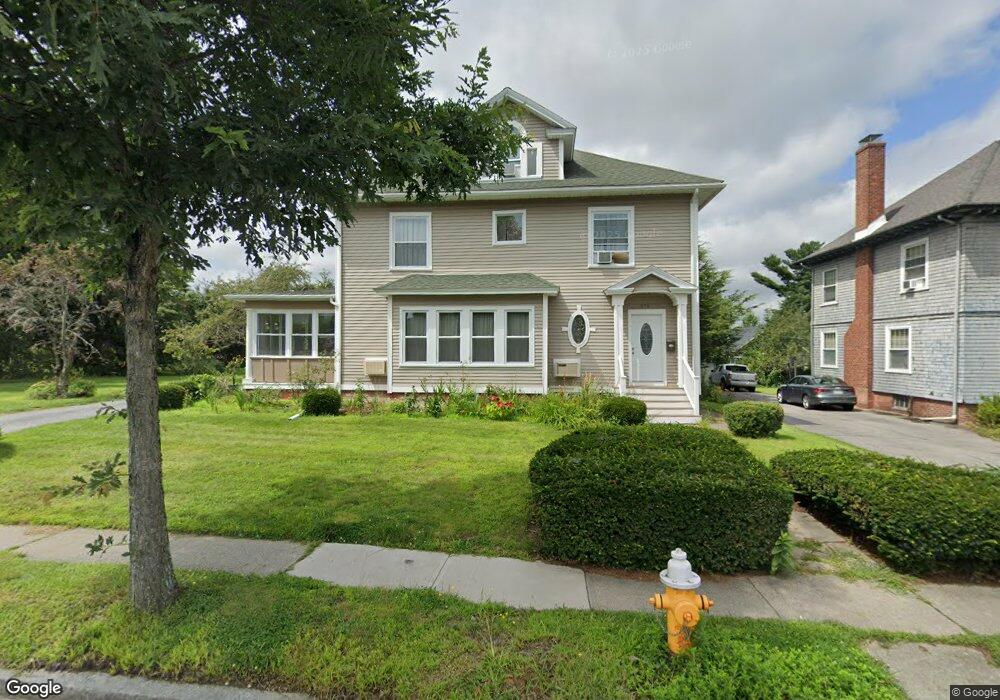
276 Burncoat St Worcester, MA 01606
Greendale NeighborhoodEstimated Value: $514,000 - $604,000
4
Beds
2
Baths
2,537
Sq Ft
$223/Sq Ft
Est. Value
About This Home
This home is located at 276 Burncoat St, Worcester, MA 01606 and is currently estimated at $565,482, approximately $222 per square foot. 276 Burncoat St is a home located in Worcester County with nearby schools including Jacob Hiatt Magnet School, Chandler Magnet, and Thorndyke Road School.
Ownership History
Date
Name
Owned For
Owner Type
Purchase Details
Closed on
Jun 1, 2018
Sold by
Nin Dennise A and Pena Leodenni N
Bought by
Altamirano-Lozano Diana A
Current Estimated Value
Home Financials for this Owner
Home Financials are based on the most recent Mortgage that was taken out on this home.
Original Mortgage
$239,590
Outstanding Balance
$205,407
Interest Rate
4.4%
Mortgage Type
New Conventional
Estimated Equity
$360,075
Purchase Details
Closed on
Dec 9, 2010
Sold by
Barnes Meredith L and Maki Cynthia
Bought by
Pena Leodenni N and Nin Dennis A
Home Financials for this Owner
Home Financials are based on the most recent Mortgage that was taken out on this home.
Original Mortgage
$250,624
Interest Rate
4.24%
Mortgage Type
Purchase Money Mortgage
Purchase Details
Closed on
Jul 21, 2004
Sold by
Holmes Mary Eleanor
Bought by
Maki Cynthia and Holmes Judith
Create a Home Valuation Report for This Property
The Home Valuation Report is an in-depth analysis detailing your home's value as well as a comparison with similar homes in the area
Home Values in the Area
Average Home Value in this Area
Purchase History
| Date | Buyer | Sale Price | Title Company |
|---|---|---|---|
| Altamirano-Lozano Diana A | $247,000 | -- | |
| Pena Leodenni N | $254,000 | -- | |
| Maki Cynthia | -- | -- |
Source: Public Records
Mortgage History
| Date | Status | Borrower | Loan Amount |
|---|---|---|---|
| Open | Altamirano-Lozano Diana A | $239,590 | |
| Previous Owner | Pena Leodenni N | $250,624 |
Source: Public Records
Tax History
| Year | Tax Paid | Tax Assessment Tax Assessment Total Assessment is a certain percentage of the fair market value that is determined by local assessors to be the total taxable value of land and additions on the property. | Land | Improvement |
|---|---|---|---|---|
| 2025 | $7,384 | $559,800 | $119,500 | $440,300 |
| 2024 | $7,194 | $523,200 | $119,500 | $403,700 |
| 2023 | $6,951 | $484,700 | $103,900 | $380,800 |
| 2022 | $6,464 | $425,000 | $83,100 | $341,900 |
| 2021 | $6,313 | $387,800 | $66,500 | $321,300 |
| 2020 | $6,282 | $369,500 | $66,400 | $303,100 |
| 2019 | $5,861 | $325,600 | $60,100 | $265,500 |
| 2018 | $5,302 | $280,400 | $60,100 | $220,300 |
| 2017 | $5,191 | $270,100 | $60,100 | $210,000 |
| 2016 | $5,258 | $255,100 | $45,600 | $209,500 |
| 2015 | $5,120 | $255,100 | $45,600 | $209,500 |
| 2014 | $4,266 | $218,300 | $45,600 | $172,700 |
Source: Public Records
Map
Nearby Homes
- 169 Whitmarsh Ave
- 323 Burncoat St
- 94 Kendrick Ave
- 331 Burncoat St
- 66 Eunice Ave
- 39 Whitmarsh Ave
- 58 Osceola Ave
- 15 Ericsson St
- 18 Gosnold St
- 248 Saint Nicholas Ave
- 3205 Halcyon Dr Unit 3205
- 2101 Halcyon Dr Unit 2101
- 30 Danielles Way
- 18 Danielles Way
- 110 Beverly Rd
- 100 Burncoat St
- 25 Kenwood Ave
- 93 Blue Bell Rd
- 6 Ashburnham Rd
- 63 Cobblestone Ln Unit 63
- 272 Burncoat St
- 278 Burncoat St
- 54 Hillcroft Ave
- 52 Hillcroft Ave
- 62 Hillcroft Ave
- 268 Burncoat St
- 268 Burncoat St Unit 1
- 50 Hillcroft Ave
- 282 Burncoat St
- 64 Hillcroft Ave
- 273 Burncoat St
- 193 King Philip Rd
- 1 Bellingham Rd
- 284 Burncoat St
- 1 Coventry Rd
- 281 Burncoat St
- 266 Burncoat St
- 266 Burncoat St Unit 1
- 266 Burncoat St Unit 2
- 74 Hillcroft Ave
Your Personal Tour Guide
Ask me questions while you tour the home.