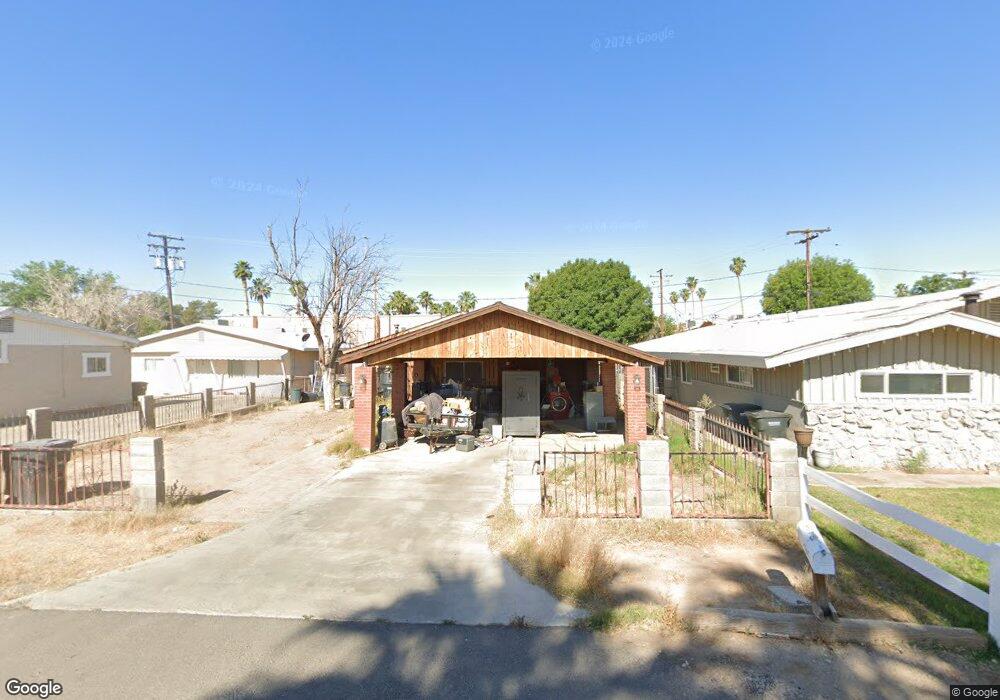
276 N 9th St Blythe, CA 92225
Estimated Value: $131,000 - $286,000
3
Beds
3
Baths
1,498
Sq Ft
$115/Sq Ft
Est. Value
About This Home
This home is located at 276 N 9th St, Blythe, CA 92225 and is currently estimated at $172,297, approximately $115 per square foot. 276 N 9th St is a home located in Riverside County with nearby schools including Palo Verde High School and Scale Leadership Academy - East.
Ownership History
Date
Name
Owned For
Owner Type
Purchase Details
Closed on
Jun 20, 1997
Sold by
Taylor Larry R
Bought by
Taylor Denise D
Current Estimated Value
Purchase Details
Closed on
Apr 10, 1997
Sold by
S & L Properties Llc
Bought by
Taylor Denise D
Home Financials for this Owner
Home Financials are based on the most recent Mortgage that was taken out on this home.
Original Mortgage
$92,945
Interest Rate
7.91%
Mortgage Type
FHA
Create a Home Valuation Report for This Property
The Home Valuation Report is an in-depth analysis detailing your home's value as well as a comparison with similar homes in the area
Home Values in the Area
Average Home Value in this Area
Purchase History
| Date | Buyer | Sale Price | Title Company |
|---|---|---|---|
| Taylor Denise D | -- | First American Title Ins Co | |
| Taylor Denise D | $94,000 | First American Title Ins Co |
Source: Public Records
Mortgage History
| Date | Status | Borrower | Loan Amount |
|---|---|---|---|
| Previous Owner | Taylor Denise D | $92,945 |
Source: Public Records
Tax History Compared to Growth
Tax History
| Year | Tax Paid | Tax Assessment Tax Assessment Total Assessment is a certain percentage of the fair market value that is determined by local assessors to be the total taxable value of land and additions on the property. | Land | Improvement |
|---|---|---|---|---|
| 2025 | $1,760 | $152,891 | $32,553 | $120,338 |
| 2023 | $1,760 | $146,956 | $31,290 | $115,666 |
| 2022 | $1,639 | $139,136 | $28,987 | $110,149 |
| 2021 | $1,343 | $113,118 | $23,566 | $89,552 |
| 2020 | $1,230 | $102,835 | $21,424 | $81,411 |
| 2019 | $1,208 | $99,840 | $20,800 | $79,040 |
| 2018 | $1,120 | $96,000 | $20,000 | $76,000 |
| 2017 | $1,076 | $92,000 | $20,000 | $72,000 |
| 2016 | $1,074 | $91,000 | $19,000 | $72,000 |
| 2015 | $993 | $83,000 | $18,000 | $65,000 |
| 2014 | $935 | $79,000 | $17,000 | $62,000 |
Source: Public Records
Map
Nearby Homes