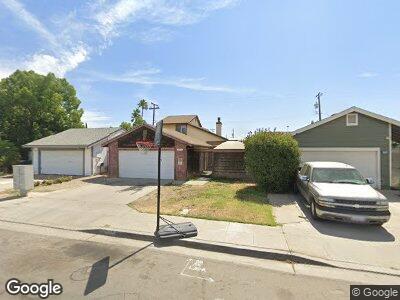
2760 N Selland Ave Fresno, CA 93722
West Fresno NeighborhoodEstimated Value: $302,345 - $322,000
3
Beds
2
Baths
1,356
Sq Ft
$232/Sq Ft
Est. Value
About This Home
This home is located at 2760 N Selland Ave, Fresno, CA 93722 and is currently estimated at $314,836, approximately $232 per square foot. 2760 N Selland Ave is a home located in Fresno County with nearby schools including Hanh Phan Tilley Elementary, El Capitan Middle School, and Central East High School.
Ownership History
Date
Name
Owned For
Owner Type
Purchase Details
Closed on
Sep 15, 2023
Sold by
Daccarett Jose Mario Quinonez and Daccarett Maria
Bought by
Carlock Carol and Carlock Jeff
Current Estimated Value
Home Financials for this Owner
Home Financials are based on the most recent Mortgage that was taken out on this home.
Original Mortgage
$135,000
Outstanding Balance
$133,618
Interest Rate
6.96%
Mortgage Type
New Conventional
Purchase Details
Closed on
Jan 2, 2023
Sold by
Lori Kennedy Living Trust
Bought by
Daccarett Jose Mario Quinon and Ortiz Maria
Home Financials for this Owner
Home Financials are based on the most recent Mortgage that was taken out on this home.
Original Mortgage
$166,500
Interest Rate
6.58%
Mortgage Type
New Conventional
Purchase Details
Closed on
Sep 18, 2012
Sold by
Wong Blake M
Bought by
Wong Blake M and Wong Angela
Home Financials for this Owner
Home Financials are based on the most recent Mortgage that was taken out on this home.
Original Mortgage
$75,000
Interest Rate
3.55%
Mortgage Type
New Conventional
Create a Home Valuation Report for This Property
The Home Valuation Report is an in-depth analysis detailing your home's value as well as a comparison with similar homes in the area
Home Values in the Area
Average Home Value in this Area
Purchase History
| Date | Buyer | Sale Price | Title Company |
|---|---|---|---|
| Carlock Jeff | -- | Chicago Title | |
| Carlock Carol | $325,000 | Chicago Title | |
| Daccarett Jose Mario Quinon | $222,000 | Chicago Title | |
| Wong Blake M | -- | Lsi Title Company |
Source: Public Records
Mortgage History
| Date | Status | Borrower | Loan Amount |
|---|---|---|---|
| Open | Carlock Carol | $135,000 | |
| Previous Owner | Daccarett Jose Mario Quinon | $166,500 | |
| Previous Owner | Wong Blake M | $75,000 | |
| Previous Owner | Wong Blake M | $57,237 |
Source: Public Records
Tax History Compared to Growth
Tax History
| Year | Tax Paid | Tax Assessment Tax Assessment Total Assessment is a certain percentage of the fair market value that is determined by local assessors to be the total taxable value of land and additions on the property. | Land | Improvement |
|---|---|---|---|---|
| 2023 | $1,673 | $126,216 | $28,838 | $97,378 |
| 2022 | $1,582 | $123,742 | $28,273 | $95,469 |
| 2021 | $1,594 | $121,317 | $27,719 | $93,598 |
| 2020 | $1,518 | $120,074 | $27,435 | $92,639 |
| 2019 | $1,496 | $117,721 | $26,898 | $90,823 |
| 2018 | $1,463 | $115,414 | $26,371 | $89,043 |
| 2017 | $1,468 | $113,152 | $25,854 | $87,298 |
| 2016 | $1,356 | $110,935 | $25,348 | $85,587 |
| 2015 | $1,351 | $109,270 | $24,968 | $84,302 |
| 2014 | $1,350 | $107,130 | $24,479 | $82,651 |
Source: Public Records
Map
Nearby Homes
- 2736 N Selland Ave
- 2765 N Dewey Ave
- 3425 W Forrest Dr
- 3575 W Cortland Ave
- 2409 N Valentine Ave
- 3622 W Terrace Ave
- 3681 W Garland Ave
- 3256 W Clinton Ave
- 3732 W Garland Ave
- 3395 N Dewey Ave
- 3694 W Robinson Ave
- 3614 W Dakota Ave
- 3561 W Weldon Ave
- 2413 N Sonora Ave
- 3375 N Berlin Ave
- 4131 W Ramona Ave
- 3395 N Berlin Ave
- 2287 N Vernal Ave
- 3516 N Brawley Ave
- 2347 N Sonora Ave
- 2760 N Selland Ave
- 2754 N Selland Ave
- 2766 N Selland Ave
- 2772 N Selland Ave
- 2742 N Selland Ave
- 2778 N Selland Ave
- 2761 N Selland Ave
- 2755 N Selland Ave
- 2767 N Selland Ave
- 2749 N Selland Ave
- 2773 N Selland Ave
- 2784 N Selland Ave
- 2779 N Selland Ave
- 2743 N Selland Ave
- 2730 N Selland Ave
- 2789 N Selland Ave
- 2724 N Selland Ave
- 2758 N Dewey Ave
- 2752 N Dewey Ave