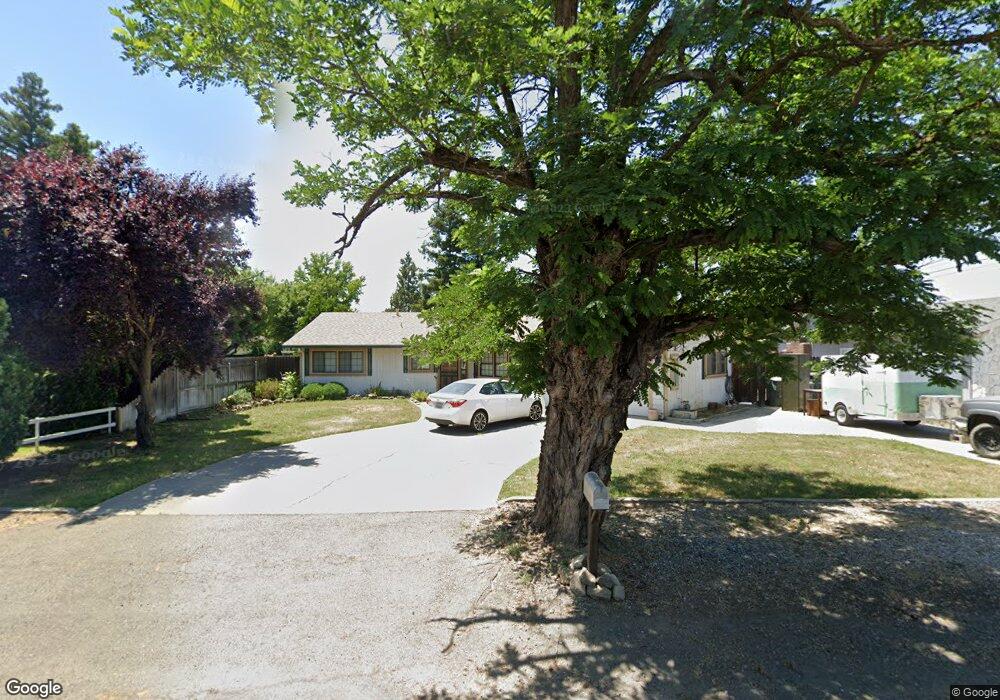
2760 Oak St Sutter, CA 95982
Estimated Value: $398,928 - $438,000
3
Beds
2
Baths
1,650
Sq Ft
$257/Sq Ft
Est. Value
About This Home
This home is located at 2760 Oak St, Sutter, CA 95982 and is currently estimated at $423,732, approximately $256 per square foot. 2760 Oak St is a home located in Sutter County with nearby schools including Brittan Elementary School, Sutter High School, and Faith Christian Schools.
Ownership History
Date
Name
Owned For
Owner Type
Purchase Details
Closed on
Oct 4, 2017
Sold by
Webstr Sarah L and Wulfert Sarah L
Bought by
Wulfert Sarah L and Wulfert Ryan
Current Estimated Value
Home Financials for this Owner
Home Financials are based on the most recent Mortgage that was taken out on this home.
Original Mortgage
$228,000
Outstanding Balance
$190,444
Interest Rate
3.82%
Mortgage Type
New Conventional
Estimated Equity
$233,288
Purchase Details
Closed on
Jun 22, 2009
Sold by
Morrow Mary E
Bought by
Webster Sarah L
Home Financials for this Owner
Home Financials are based on the most recent Mortgage that was taken out on this home.
Original Mortgage
$204,081
Interest Rate
4.82%
Mortgage Type
Purchase Money Mortgage
Purchase Details
Closed on
Nov 11, 2004
Sold by
Wittmuss Roberta Mae and Wittmuss Roberta
Bought by
Wittmuss Roberta Mae
Purchase Details
Closed on
Oct 16, 2003
Sold by
Riddell Virginia A
Bought by
Riddell Virginia A
Create a Home Valuation Report for This Property
The Home Valuation Report is an in-depth analysis detailing your home's value as well as a comparison with similar homes in the area
Home Values in the Area
Average Home Value in this Area
Purchase History
| Date | Buyer | Sale Price | Title Company |
|---|---|---|---|
| Wulfert Sarah L | -- | Old Republic Title Co | |
| Webster Sarah L | $200,000 | First American Title Company | |
| Wittmuss Roberta Mae | -- | -- | |
| Riddell Virginia A | -- | -- | |
| Riddell Virginia A | -- | -- |
Source: Public Records
Mortgage History
| Date | Status | Borrower | Loan Amount |
|---|---|---|---|
| Open | Wulfert Sarah L | $228,000 | |
| Closed | Webster Sarah L | $204,081 |
Source: Public Records
Tax History
| Year | Tax Paid | Tax Assessment Tax Assessment Total Assessment is a certain percentage of the fair market value that is determined by local assessors to be the total taxable value of land and additions on the property. | Land | Improvement |
|---|---|---|---|---|
| 2025 | $2,675 | $257,532 | $57,939 | $199,593 |
| 2024 | $2,675 | $252,483 | $56,803 | $195,680 |
| 2023 | $2,675 | $247,534 | $55,690 | $191,844 |
| 2022 | $2,592 | $242,682 | $54,599 | $188,083 |
| 2021 | $2,567 | $237,941 | $53,537 | $184,404 |
| 2020 | $2,533 | $235,501 | $52,988 | $182,513 |
| 2019 | $2,700 | $230,882 | $51,948 | $178,934 |
| 2018 | $2,673 | $226,354 | $50,930 | $175,424 |
| 2017 | $2,537 | $221,916 | $49,931 | $171,985 |
| 2016 | $2,518 | $217,564 | $48,952 | $168,612 |
Source: Public Records
Map
Nearby Homes
- 2371 Elm St
- 2431 Madrone St
- 7669 Barrow St
- 2227 W Ridge Dr
- 2211 W Ridge Dr
- 2185 Perry St
- 1939 1st Ave
- 8617 S Butte Rd
- 5576 S Butte Rd
- 1244 Acacia Ave
- 8454 Pass Rd
- 8970 S Butte Rd
- 2065 Howlett Ave
- 4423 Dresser Rd
- 4361 Dresser Rd
- 1803 Lynchburg Dr
- 1270 Tulio St
- 3295 Jefferson Ave
- 3327 Sam Brannan Way
- 2127 Pepperwood Dr
- 6725 College Ave
- 6789 College Ave
- 2767 Cypress St
- 6730 Butte House Rd
- 2765 Oak St
- 6740 Butte House Rd
- 2701 Oak St
- 2783 Oak St
- 2680 Oak St
- 6740 College Ave
- 0 Cypress St
- 6760 College Ave
- 6735 Butte House Rd
- 2671 Oak St
- 6827 College Ave
- 6745 Butte House Rd
- 2776 Cypress St
- 2662 Oak St
- 2659 Cypress St
- 6824 College Ave
Your Personal Tour Guide
Ask me questions while you tour the home.