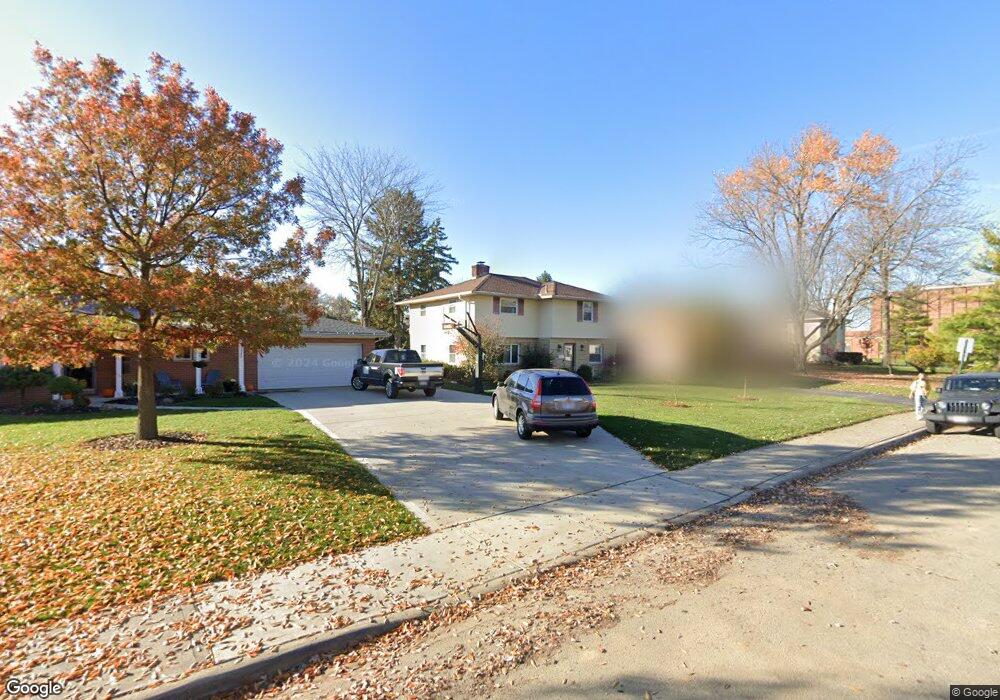
2763 Westmont Blvd Columbus, OH 43221
Estimated Value: $755,214 - $954,000
4
Beds
3
Baths
2,464
Sq Ft
$344/Sq Ft
Est. Value
About This Home
This home is located at 2763 Westmont Blvd, Columbus, OH 43221 and is currently estimated at $846,554, approximately $343 per square foot. 2763 Westmont Blvd is a home located in Franklin County with nearby schools including Tremont Elementary School, Jones Middle School, and Upper Arlington High School.
Ownership History
Date
Name
Owned For
Owner Type
Purchase Details
Closed on
Jan 23, 2009
Sold by
Sharma Gavaskar Arun Ramchandra and Sharma Gavaskar Vandana
Bought by
Li Wu Yiying and Li Xiao
Current Estimated Value
Home Financials for this Owner
Home Financials are based on the most recent Mortgage that was taken out on this home.
Original Mortgage
$15,000
Outstanding Balance
$9,405
Interest Rate
5.03%
Mortgage Type
Credit Line Revolving
Estimated Equity
$837,149
Purchase Details
Closed on
May 17, 2002
Sold by
Lehman Scott C and Lehman Tamatha H
Bought by
Sharma Gavaskar Arun Ramchandra and Sharma Gavaskar Vandana
Home Financials for this Owner
Home Financials are based on the most recent Mortgage that was taken out on this home.
Original Mortgage
$234,000
Outstanding Balance
$99,296
Interest Rate
7%
Mortgage Type
Purchase Money Mortgage
Estimated Equity
$747,258
Purchase Details
Closed on
Sep 19, 1997
Sold by
Seidel Richard C and Seidel Marymae
Bought by
Lehman Scott C and Lehman Tamatha H
Create a Home Valuation Report for This Property
The Home Valuation Report is an in-depth analysis detailing your home's value as well as a comparison with similar homes in the area
Home Values in the Area
Average Home Value in this Area
Purchase History
| Date | Buyer | Sale Price | Title Company |
|---|---|---|---|
| Li Wu Yiying | $300,000 | Title First | |
| Sharma Gavaskar Arun Ramchandra | $293,000 | -- | |
| Lehman Scott C | $216,000 | -- |
Source: Public Records
Mortgage History
| Date | Status | Borrower | Loan Amount |
|---|---|---|---|
| Open | Li Wu Yiying | $15,000 | |
| Open | Sharma Gavaskar Arun Ramchandra | $234,000 |
Source: Public Records
Tax History Compared to Growth
Tax History
| Year | Tax Paid | Tax Assessment Tax Assessment Total Assessment is a certain percentage of the fair market value that is determined by local assessors to be the total taxable value of land and additions on the property. | Land | Improvement |
|---|---|---|---|---|
| 2024 | $12,032 | $207,840 | $82,780 | $125,060 |
| 2023 | $11,883 | $207,830 | $82,775 | $125,055 |
| 2022 | $11,192 | $160,160 | $60,900 | $99,260 |
| 2021 | $9,907 | $160,160 | $60,900 | $99,260 |
| 2020 | $9,819 | $160,160 | $60,900 | $99,260 |
| 2019 | $9,533 | $137,480 | $60,900 | $76,580 |
| 2018 | $8,665 | $137,480 | $60,900 | $76,580 |
| 2017 | $9,460 | $137,480 | $60,900 | $76,580 |
| 2016 | $7,857 | $118,830 | $35,530 | $83,300 |
| 2015 | $7,850 | $118,830 | $35,530 | $83,300 |
| 2014 | $7,859 | $118,830 | $35,530 | $83,300 |
| 2013 | $3,754 | $108,045 | $32,305 | $75,740 |
Source: Public Records
Map
Nearby Homes
- 2648 Chester Rd
- 2569 Chester Rd
- 2615 Northwest Blvd
- 3015 Welsford Rd
- 1909 Inchcliff Rd
- 1980 W Lane Ave
- 3156 Mt Holyoke Rd
- 1887-1891 Kentwell Rd
- 1565 Berkshire Rd
- 2027-2033 Ridgeview Rd
- 3106 Somerford Rd
- 1111 Sunny Hill Dr
- 1535 Doone Rd
- 1481 Doone Rd
- 1098 Stanhope Dr
- 2063 Westover Rd
- 3296 Leighton Rd
- 2110 Northwest Blvd
- 965 Manor Ln Unit W
- 3444 Sunningdale Way
- 2775 Westmont Blvd
- 2751 Westmont Blvd
- 1609 Ridgeview Rd
- 2739 Westmont Blvd
- 2770 Chester Rd
- 2778 Chester Rd
- 2760 Chester Rd
- 2764 Westmont Blvd
- 2786 Chester Rd
- 2774 Westmont Blvd
- 2750 Westmont Blvd
- 2796 Chester Rd
- 2750 Chester Rd
- 2727 Westmont Blvd
- 1581 Ridgeview Rd
- 2738 Westmont Blvd
- 2738 Chester Rd
- 2726 Westmont Blvd
- 2763 Mount Holyoke Rd
- 2753 Mount Holyoke Rd