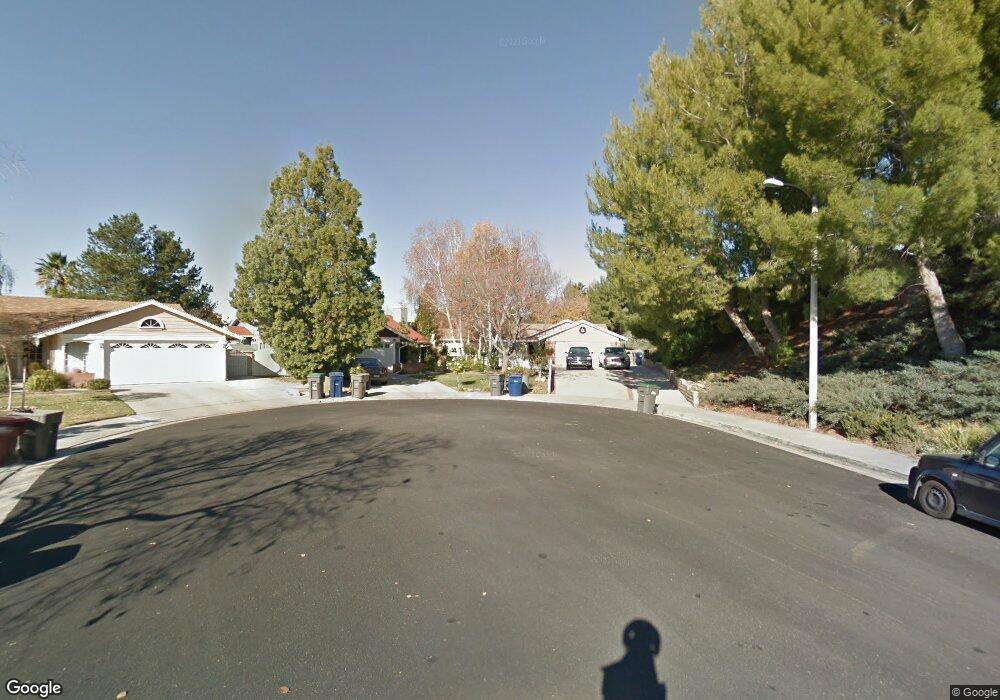
27636 Renwick Ct Santa Clarita, CA 91350
Saugus NeighborhoodEstimated Value: $724,936 - $766,000
2
Beds
2
Baths
1,006
Sq Ft
$738/Sq Ft
Est. Value
About This Home
This home is located at 27636 Renwick Ct, Santa Clarita, CA 91350 and is currently estimated at $741,984, approximately $737 per square foot. 27636 Renwick Ct is a home located in Los Angeles County with nearby schools including James Foster Elementary School, Arroyo Seco Junior High School, and Saugus High School.
Ownership History
Date
Name
Owned For
Owner Type
Purchase Details
Closed on
Apr 23, 1999
Sold by
Searcy Ralph L and Deily Diane T
Bought by
Searcy Ralph L
Current Estimated Value
Home Financials for this Owner
Home Financials are based on the most recent Mortgage that was taken out on this home.
Original Mortgage
$150,204
Outstanding Balance
$37,844
Interest Rate
6.98%
Estimated Equity
$704,140
Purchase Details
Closed on
Oct 18, 1996
Sold by
Federal Home Loan Mortgage Corporation
Bought by
Searcy Ralph L and Deilly Diane T
Home Financials for this Owner
Home Financials are based on the most recent Mortgage that was taken out on this home.
Original Mortgage
$151,050
Interest Rate
8.3%
Purchase Details
Closed on
Jul 1, 1996
Sold by
Faulkner Catherine L and Ge Capital Mtg Services Inc
Bought by
Ge Capital Mtg Services Inc
Purchase Details
Closed on
Jun 20, 1996
Sold by
Ge Capital Mtg Services Inc
Bought by
Federal Home Loan Mortgage Corporation
Create a Home Valuation Report for This Property
The Home Valuation Report is an in-depth analysis detailing your home's value as well as a comparison with similar homes in the area
Home Values in the Area
Average Home Value in this Area
Purchase History
| Date | Buyer | Sale Price | Title Company |
|---|---|---|---|
| Searcy Ralph L | -- | Landsafe Title Company | |
| Searcy Ralph L | $159,000 | Orange Coast Title | |
| Ge Capital Mtg Services Inc | $162,000 | Stewart Title | |
| Federal Home Loan Mortgage Corporation | -- | Stewart Title |
Source: Public Records
Mortgage History
| Date | Status | Borrower | Loan Amount |
|---|---|---|---|
| Open | Searcy Ralph L | $150,204 | |
| Previous Owner | Searcy Ralph L | $151,050 |
Source: Public Records
Tax History Compared to Growth
Tax History
| Year | Tax Paid | Tax Assessment Tax Assessment Total Assessment is a certain percentage of the fair market value that is determined by local assessors to be the total taxable value of land and additions on the property. | Land | Improvement |
|---|---|---|---|---|
| 2025 | $4,127 | $263,488 | $117,343 | $146,145 |
| 2024 | $4,127 | $258,323 | $115,043 | $143,280 |
| 2023 | $3,995 | $253,259 | $112,788 | $140,471 |
| 2022 | $4,003 | $248,294 | $110,577 | $137,717 |
| 2021 | $3,936 | $243,426 | $108,409 | $135,017 |
| 2019 | $3,804 | $236,208 | $105,195 | $131,013 |
| 2018 | $3,633 | $231,578 | $103,133 | $128,445 |
| 2016 | $3,425 | $222,587 | $99,129 | $123,458 |
| 2015 | $3,298 | $219,244 | $97,640 | $121,604 |
| 2014 | $3,252 | $214,950 | $95,728 | $119,222 |
Source: Public Records
Map
Nearby Homes
- 27573 Santa Clarita Rd
- 27929 Dexter Dr
- 27829 Carnegie Ave
- 22654 La Rochelle Dr
- 22660 La Rochelle Dr
- 27439 Santa Clarita Rd
- 27362 Santa Clarita Rd
- 27872 Cherry Creek Dr
- 22403 Los Rogues Dr
- 22617 Copper Hill Dr Unit 121
- 22713 Copper Hill Dr Unit 42
- 28114 Seco Canyon Rd Unit 156
- 27717 Sequoia Glen Dr
- 28121 Seco Canyon Rd Unit 86
- 27619 Ron Ridge Dr
- 28123 Seco Canyon Rd Unit 94
- 21965 Jeffers Ln
- 22035 Conway Place
- 22949 Sycamore Creek Dr
- 28241 Tamarack Ln
- 27641 Renwick Ct
- 27737 Crookshank Dr
- 27733 Crookshank Dr
- 27733 Crookshank Dr
- 27743 Crookshank Dr
- 27639 Renwick Ct
- 27642 Spandau Dr
- 27727 Crookshank Dr
- 27636 Spandau Dr
- 27749 Crookshank Dr
- 27648 Spandau Dr
- 27630 Spandau Dr
- 27721 Crookshank Dr
- 27633 Renwick Ct
- 27635 Renwick Ct
- 27757 Crookshank Dr
- 27627 Renwick Ct
- 27622 Spandau Dr
- 27654 Spandau Dr
- 27728 Crookshank Dr