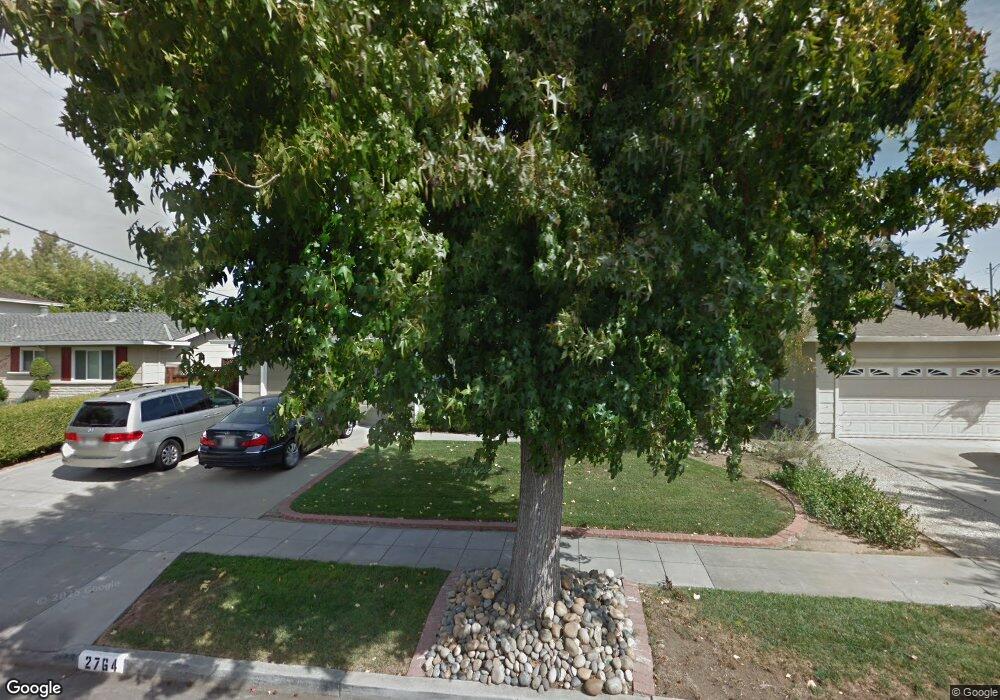
2764 Quinto Way San Jose, CA 95124
Doerr-Steindorf NeighborhoodEstimated Value: $1,901,000 - $2,271,000
4
Beds
2
Baths
1,884
Sq Ft
$1,127/Sq Ft
Est. Value
About This Home
This home is located at 2764 Quinto Way, San Jose, CA 95124 and is currently estimated at $2,122,856, approximately $1,126 per square foot. 2764 Quinto Way is a home located in Santa Clara County with nearby schools including Branham High School, Fammatre Elementary School, and Sartorette Charter School.
Ownership History
Date
Name
Owned For
Owner Type
Purchase Details
Closed on
Mar 16, 2011
Sold by
Baynes Andrew and Baynes Stephanie
Bought by
Reddyreddy Praveen K and Banda Smitha
Current Estimated Value
Home Financials for this Owner
Home Financials are based on the most recent Mortgage that was taken out on this home.
Original Mortgage
$626,250
Outstanding Balance
$403,259
Interest Rate
3.5%
Mortgage Type
New Conventional
Estimated Equity
$1,719,597
Purchase Details
Closed on
Jan 14, 2006
Sold by
Baynes Andrew C and Baynes Stephanie
Bought by
Baynes Andrew and Baynes Stephanie
Purchase Details
Closed on
Jul 8, 2005
Sold by
Peterson Mark and Peterson Robbie
Bought by
Baynes Andrew C and Baynes Stephanie
Home Financials for this Owner
Home Financials are based on the most recent Mortgage that was taken out on this home.
Original Mortgage
$700,000
Interest Rate
5.5%
Mortgage Type
Purchase Money Mortgage
Create a Home Valuation Report for This Property
The Home Valuation Report is an in-depth analysis detailing your home's value as well as a comparison with similar homes in the area
Home Values in the Area
Average Home Value in this Area
Purchase History
| Date | Buyer | Sale Price | Title Company |
|---|---|---|---|
| Reddyreddy Praveen K | $835,000 | Fidelity National Title Co | |
| Baynes Andrew | -- | None Available | |
| Baynes Andrew C | $875,000 | North American Title Company |
Source: Public Records
Mortgage History
| Date | Status | Borrower | Loan Amount |
|---|---|---|---|
| Open | Reddyreddy Praveen K | $626,250 | |
| Previous Owner | Baynes Andrew C | $700,000 |
Source: Public Records
Tax History Compared to Growth
Tax History
| Year | Tax Paid | Tax Assessment Tax Assessment Total Assessment is a certain percentage of the fair market value that is determined by local assessors to be the total taxable value of land and additions on the property. | Land | Improvement |
|---|---|---|---|---|
| 2025 | $14,238 | $1,069,770 | $748,841 | $320,929 |
| 2024 | $14,238 | $1,048,795 | $734,158 | $314,637 |
| 2023 | $14,146 | $1,028,231 | $719,763 | $308,468 |
| 2022 | $13,893 | $1,008,070 | $705,650 | $302,420 |
| 2021 | $13,627 | $988,305 | $691,814 | $296,491 |
| 2020 | $13,010 | $978,172 | $684,721 | $293,451 |
| 2019 | $12,855 | $958,994 | $671,296 | $287,698 |
| 2018 | $12,503 | $940,191 | $658,134 | $282,057 |
| 2017 | $12,281 | $921,757 | $645,230 | $276,527 |
| 2016 | $11,697 | $903,684 | $632,579 | $271,105 |
| 2015 | $11,559 | $890,111 | $623,078 | $267,033 |
| 2014 | $10,951 | $872,676 | $610,873 | $261,803 |
Source: Public Records
Map
Nearby Homes
- 2934 Custer Dr
- 1828 Nestorita Way
- 1688 Grizilo Dr
- 2881 Meridian Ave Unit 217
- 2881 Meridian Ave Unit 146
- 3266 Kimber Ct Unit 128
- 2514 Meridian Ave
- 2462 Meridian Ave
- 1674 Husted Ave
- 3274 Todd Way
- 2518 Aragon Way
- 2495 Malaga Dr
- 1679 Catalonia Way
- 1800 Donna Ln
- 2433 New Jersey Ave
- 1799 Bradford Way
- 2425 Briarwood Dr
- 3076 Union Ave
- 14361 Lenray Ln
- 1598 Willowbrook Dr
- 2762 Quinto Way
- 1785 El Codo Way
- 1810 Potrero Dr
- 2760 Quinto Way
- 1783 El Codo Way
- 1808 Potrero Dr
- 2765 Quinto Way
- 2757 Quinto Way
- 2773 Quinto Way
- 2749 Quinto Way
- 1781 El Codo Way
- 1804 Potrero Dr
- 1790 El Codo Way
- 1786 El Codo Way
- 2781 Quinto Way
- 1784 El Codo Way
- 2741 Quinto Way
- 1777 El Codo Way
- 1802 Potrero Dr
- 2762 Custer Dr