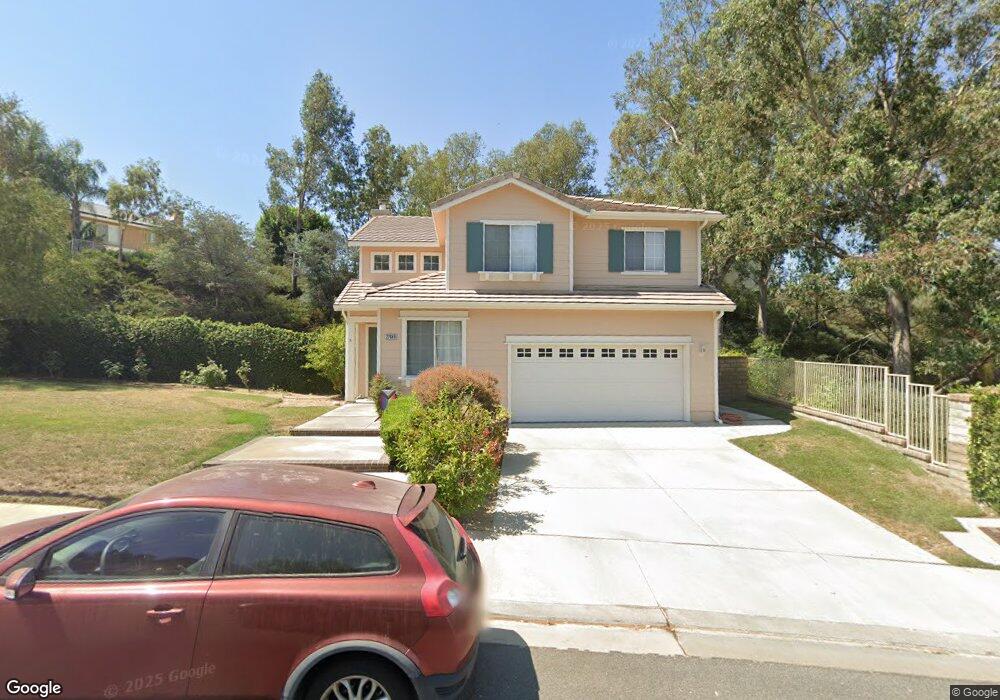
27649 Briarcliff Place Valencia, CA 91354
Estimated Value: $976,000 - $1,031,000
4
Beds
3
Baths
2,470
Sq Ft
$409/Sq Ft
Est. Value
About This Home
This home is located at 27649 Briarcliff Place, Valencia, CA 91354 and is currently estimated at $1,010,554, approximately $409 per square foot. 27649 Briarcliff Place is a home located in Los Angeles County with nearby schools including North Park Elementary School, Rio Norte Junior High School, and Valencia High School.
Ownership History
Date
Name
Owned For
Owner Type
Purchase Details
Closed on
May 23, 2006
Sold by
Benepe Brandon John and Benepe Lesley Dionne
Bought by
Benepe Brandon John and Benepe Lesley Dionne
Current Estimated Value
Purchase Details
Closed on
Sep 5, 1996
Sold by
Greystone Homes Inc
Bought by
Benepe Brandon John and Benepe Lesley Dionne
Home Financials for this Owner
Home Financials are based on the most recent Mortgage that was taken out on this home.
Original Mortgage
$202,900
Interest Rate
7.67%
Purchase Details
Closed on
Aug 7, 1995
Sold by
Carceller Jose Ramon
Bought by
Carceller Emily Ann
Purchase Details
Closed on
May 24, 1995
Sold by
The Newhall Land & Farming Company
Bought by
Beazer Homes California Inc
Purchase Details
Closed on
May 5, 1995
Sold by
Rousseaux Maria Teresa
Bought by
Rousseaux Jaime
Purchase Details
Closed on
Dec 30, 1994
Sold by
Butler Kimberly S
Bought by
Butler Jeffrey A
Create a Home Valuation Report for This Property
The Home Valuation Report is an in-depth analysis detailing your home's value as well as a comparison with similar homes in the area
Home Values in the Area
Average Home Value in this Area
Purchase History
| Date | Buyer | Sale Price | Title Company |
|---|---|---|---|
| Benepe Brandon John | -- | None Available | |
| Benepe Brandon John | $271,000 | Chicago Title | |
| Carceller Emily Ann | -- | Chicago Title Co | |
| Beazer Homes California Inc | -- | Chicago Title Co | |
| Rousseaux Jaime | -- | Chicago Title Company | |
| Butler Jeffrey A | -- | Chicago Title Company |
Source: Public Records
Mortgage History
| Date | Status | Borrower | Loan Amount |
|---|---|---|---|
| Previous Owner | Benepe Brandon John | $202,900 |
Source: Public Records
Tax History Compared to Growth
Tax History
| Year | Tax Paid | Tax Assessment Tax Assessment Total Assessment is a certain percentage of the fair market value that is determined by local assessors to be the total taxable value of land and additions on the property. | Land | Improvement |
|---|---|---|---|---|
| 2025 | $6,757 | $452,938 | $179,143 | $273,795 |
| 2024 | $6,757 | $444,058 | $175,631 | $268,427 |
| 2023 | $6,582 | $435,352 | $172,188 | $263,164 |
| 2022 | $6,578 | $426,816 | $168,812 | $258,004 |
| 2021 | $6,435 | $418,448 | $165,502 | $252,946 |
| 2019 | $6,214 | $406,039 | $160,594 | $245,445 |
| 2018 | $6,089 | $398,079 | $157,446 | $240,633 |
| 2016 | $5,746 | $382,623 | $151,333 | $231,290 |
| 2015 | $5,543 | $376,876 | $149,060 | $227,816 |
| 2014 | $5,473 | $369,495 | $146,141 | $223,354 |
Source: Public Records
Map
Nearby Homes
- 23318 Clifton Place
- 27829 Coldsprings Place
- 27842 Bloomfield Ct
- 23121 Magnolia Glen Dr
- 29635 Corte Ballenas
- 27371 Blueridge Dr
- 24308 Corte Tiburon
- 29623 Corte Ballenas
- 29619 Corte Ballenas
- 29610 Corte Ballenas
- 29412 Via Azul
- 29413 Via Azul
- 29416 Via Azul
- 29409 Via Azul
- 29405 Via Azul
- 29368 Via Destello
- 23614 Falcon Crest Place
- 23664 Clearidge Dr
- 27831 Silverton Ct
- 27439 Santa Clarita Rd
- 27607 Briarcliff Place
- 27611 Briarcliff Place
- 27615 Briarcliff Place
- 27603 Briarcliff Place
- 23304 Timberlane Dr
- 27654 Briarcliff Place
- 27648 Briarcliff Place
- 27662 Briarcliff Place
- 27644 Briarcliff Place
- 27638 Briarcliff Place
- 27668 Briarcliff Place
- 27634 Briarcliff Place
- 27704 Briarcliff Place
- 27610 Briarcliff Place
- 27628 Briarcliff Place
- 27606 Briarcliff Place
- 27703 Briarcliff Place
- 27602 Briarcliff Place
- 27614 Briarcliff Place
- 27618 Briarcliff Place