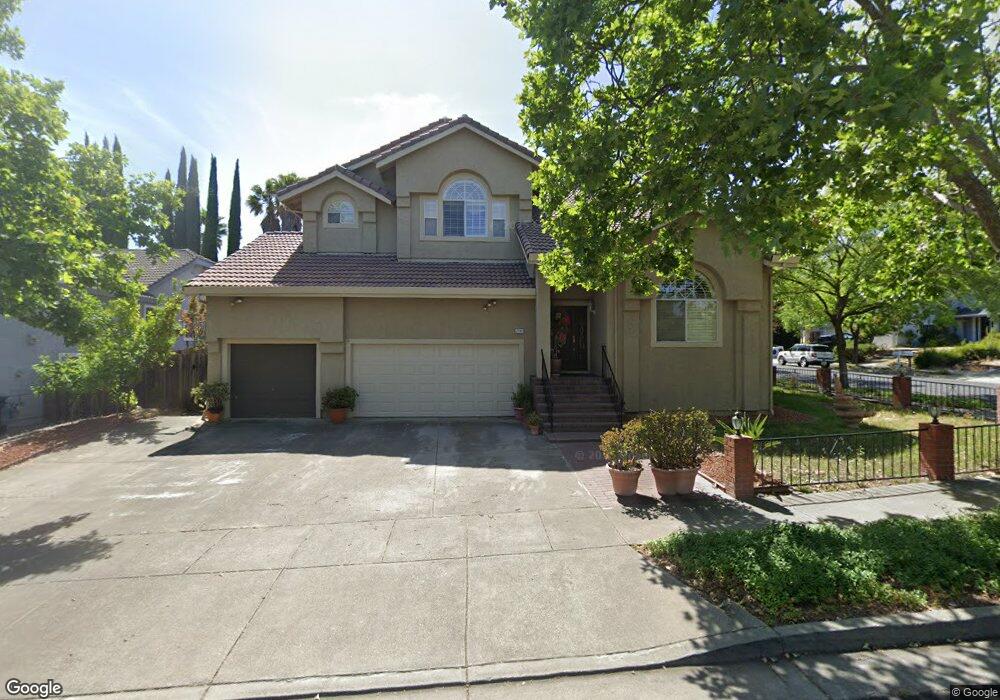
2765 Grey Fox Ln Fairfield, CA 94534
Estimated Value: $701,000 - $737,000
3
Beds
3
Baths
2,560
Sq Ft
$282/Sq Ft
Est. Value
About This Home
This home is located at 2765 Grey Fox Ln, Fairfield, CA 94534 and is currently estimated at $721,270, approximately $281 per square foot. 2765 Grey Fox Ln is a home located in Solano County with nearby schools including Rolling Hills Elementary School, Fairfield High School, and Solano Christian Academy.
Ownership History
Date
Name
Owned For
Owner Type
Purchase Details
Closed on
Nov 22, 2011
Sold by
Purificacion Renato P and Purificacion Melva
Bought by
Purificacion Renato P and Purificacion Melva N
Current Estimated Value
Purchase Details
Closed on
Jun 7, 2001
Sold by
Va
Bought by
Purificacion Renato P and Purificacion Melva
Home Financials for this Owner
Home Financials are based on the most recent Mortgage that was taken out on this home.
Original Mortgage
$154,800
Interest Rate
6.66%
Purchase Details
Closed on
May 20, 1994
Sold by
Independence One Mtg Corp
Bought by
Va
Purchase Details
Closed on
Apr 20, 1994
Sold by
Bankers Trust Company
Bought by
Independence One Mtg Corp
Purchase Details
Closed on
Dec 20, 1993
Sold by
Trott
Bought by
Bankers Trust Company
Create a Home Valuation Report for This Property
The Home Valuation Report is an in-depth analysis detailing your home's value as well as a comparison with similar homes in the area
Purchase History
| Date | Buyer | Sale Price | Title Company |
|---|---|---|---|
| Purificacion Renato P | -- | None Available | |
| Purificacion Renato P | -- | -- | |
| Va | $220,000 | North American Title Co Inc | |
| Independence One Mtg Corp | -- | Fidelity National Title | |
| Bankers Trust Company | $225,000 | -- |
Source: Public Records
Mortgage History
| Date | Status | Borrower | Loan Amount |
|---|---|---|---|
| Closed | Purificacion Renato P | $154,800 |
Source: Public Records
Tax History
| Year | Tax Paid | Tax Assessment Tax Assessment Total Assessment is a certain percentage of the fair market value that is determined by local assessors to be the total taxable value of land and additions on the property. | Land | Improvement |
|---|---|---|---|---|
| 2025 | $2,641 | $373,936 | $110,476 | $263,460 |
| 2024 | $2,641 | $366,605 | $108,310 | $258,295 |
| 2023 | $2,632 | $359,418 | $106,187 | $253,231 |
| 2022 | $4,307 | $352,371 | $104,105 | $248,266 |
| 2021 | $4,267 | $345,463 | $102,064 | $243,399 |
| 2020 | $4,176 | $341,922 | $101,018 | $240,904 |
| 2019 | $4,081 | $335,219 | $99,038 | $236,181 |
| 2018 | $4,191 | $328,647 | $97,097 | $231,550 |
| 2017 | $4,013 | $322,204 | $95,194 | $227,010 |
| 2016 | $3,984 | $315,887 | $93,328 | $222,559 |
| 2015 | $3,984 | $311,143 | $91,927 | $219,216 |
| 2014 | $3,952 | $305,049 | $90,127 | $214,922 |
Source: Public Records
Map
Nearby Homes
- 2220 Fox Glen Dr
- 120 Goya Dr
- 41 Goya Dr
- 15 Dali Ct
- 393 Manzanita Ave
- 2611 Lilac St
- 2472 Vista Grande
- 2731 Orchid St
- 278 Jasmine St
- 2707 Tuckaway Ct
- 2915 N Texas St Unit 129
- 2915 N Texas St Unit 157
- 3127 Cherry Valley Cir
- 209 Begonia Blvd
- 2827 Sunburst Dr
- 2825 Sundown Cir
- 58 Del Prado Cir
- 3442 Glen Ellen Dr
- 2292 Rutland Ct
- 2256 Dorset Ln
- 2761 Grey Fox Ln
- 2764 Silver Fox Cir
- 2760 Silver Fox Cir
- 2239 Silver Fox Cir
- 2757 Grey Fox Ln
- 2254 Silver Fox Cir
- 2260 Silver Fox Cir
- 2756 Silver Fox Cir
- 2266 Silver Fox Cir
- 2756 Grey Fox Ln
- 2235 Silver Fox Cir
- 2753 Grey Fox Ln
- 2752 Grey Fox Ln
- 2752 Silver Fox Cir
- 2765 Silver Fox Cir
- 2769 Silver Fox Cir
- 2236 Silver Fox Cir
- 2761 Silver Fox Cir
- 2272 Silver Fox Cir Unit B
Your Personal Tour Guide
Ask me questions while you tour the home.