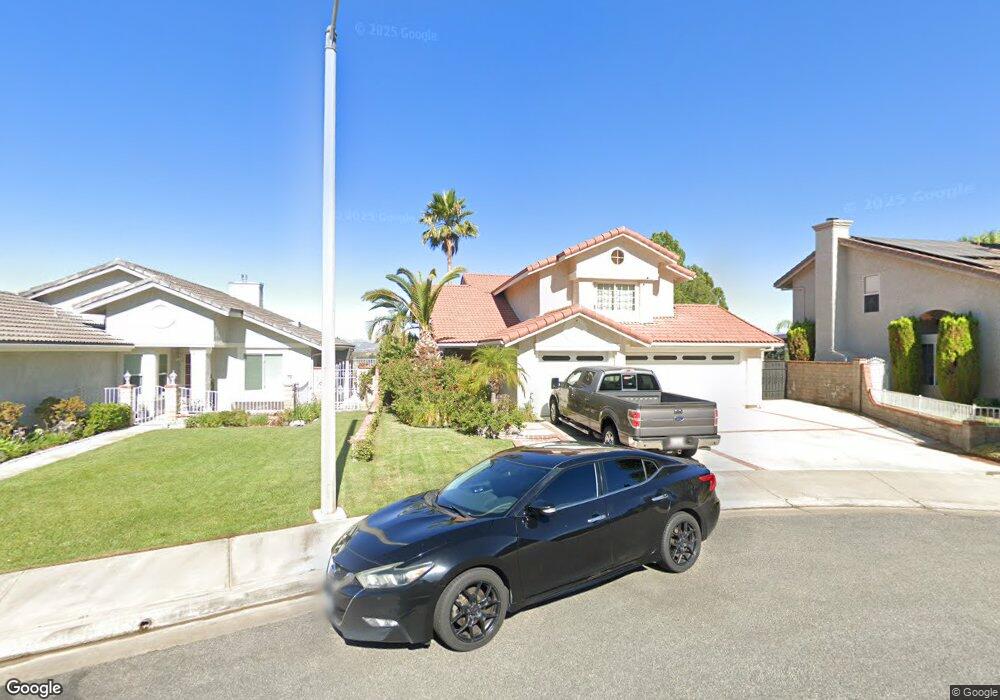
27667 Taryn Dr Santa Clarita, CA 91350
Saugus NeighborhoodEstimated Value: $792,000 - $889,000
3
Beds
3
Baths
1,680
Sq Ft
$499/Sq Ft
Est. Value
About This Home
This home is located at 27667 Taryn Dr, Santa Clarita, CA 91350 and is currently estimated at $837,865, approximately $498 per square foot. 27667 Taryn Dr is a home located in Los Angeles County with nearby schools including James Foster Elementary School, Arroyo Seco Junior High School, and Saugus High School.
Ownership History
Date
Name
Owned For
Owner Type
Purchase Details
Closed on
Dec 6, 2011
Sold by
Mathieu Gary M
Bought by
Mathieu Gary M and The Gary Mathieu Living Trust
Current Estimated Value
Purchase Details
Closed on
Mar 4, 2010
Sold by
Seals Bruce and Seals Donna
Bought by
Mathieu Gary M
Purchase Details
Closed on
May 25, 2000
Sold by
Hanson Paul W and Hanson Kim A
Bought by
Seals Bruce and Seals Donna
Home Financials for this Owner
Home Financials are based on the most recent Mortgage that was taken out on this home.
Original Mortgage
$179,999
Interest Rate
8.12%
Purchase Details
Closed on
May 19, 1999
Sold by
Holmwood Jon M and Holmwood Robin E
Bought by
Hanson Paul W and Hanson Kim A
Home Financials for this Owner
Home Financials are based on the most recent Mortgage that was taken out on this home.
Original Mortgage
$211,500
Interest Rate
6.84%
Create a Home Valuation Report for This Property
The Home Valuation Report is an in-depth analysis detailing your home's value as well as a comparison with similar homes in the area
Home Values in the Area
Average Home Value in this Area
Purchase History
| Date | Buyer | Sale Price | Title Company |
|---|---|---|---|
| Mathieu Gary M | -- | None Available | |
| Mathieu Gary M | $450,000 | Fidelity National Title | |
| Seals Bruce | $270,000 | Investors Title Company | |
| Hanson Paul W | $235,000 | Gateway Title Company |
Source: Public Records
Mortgage History
| Date | Status | Borrower | Loan Amount |
|---|---|---|---|
| Previous Owner | Seals Bruce | $179,999 | |
| Previous Owner | Hanson Paul W | $211,500 |
Source: Public Records
Tax History Compared to Growth
Tax History
| Year | Tax Paid | Tax Assessment Tax Assessment Total Assessment is a certain percentage of the fair market value that is determined by local assessors to be the total taxable value of land and additions on the property. | Land | Improvement |
|---|---|---|---|---|
| 2025 | $7,613 | $580,852 | $258,155 | $322,697 |
| 2024 | $7,613 | $569,464 | $253,094 | $316,370 |
| 2023 | $7,414 | $558,299 | $248,132 | $310,167 |
| 2022 | $7,451 | $547,353 | $243,267 | $304,086 |
| 2021 | $7,325 | $536,622 | $238,498 | $298,124 |
| 2019 | $7,054 | $520,708 | $231,425 | $289,283 |
| 2018 | $6,904 | $510,499 | $226,888 | $283,611 |
| 2016 | $6,858 | $490,678 | $218,079 | $272,599 |
| 2015 | $6,613 | $483,309 | $214,804 | $268,505 |
| 2014 | $6,512 | $473,843 | $210,597 | $263,246 |
Source: Public Records
Map
Nearby Homes
- 27829 Carnegie Ave
- 27929 Dexter Dr
- 22403 Los Rogues Dr
- 27619 Ron Ridge Dr
- 22654 La Rochelle Dr
- 22660 La Rochelle Dr
- 21965 Jeffers Ln
- 27573 Santa Clarita Rd
- 27439 Santa Clarita Rd
- 27362 Santa Clarita Rd
- 22035 Conway Place
- 22045 Milestone St
- 21929 Peppercorn Dr
- 22346 Cheraw Dr
- 21741 Jeffers Ln
- 21983 Centurion Way
- 22617 Copper Hill Dr Unit 121
- 27872 Cherry Creek Dr
- 22713 Copper Hill Dr Unit 42
- 22025 Lytle Ct
- 27663 Taryn Dr
- 27671 Taryn Dr
- 27660 Myrin Ct
- 27657 Taryn Dr
- 27664 Myrin Ct
- 27658 Myrin Ct
- 22346 Barcotta Dr
- 27653 Taryn Dr
- 22360 Barcotta Dr
- 27672 Taryn Dr
- 22342 Barcotta Dr
- 27668 Taryn Dr
- 27664 Taryn Dr
- 27654 Myrin Ct
- 27658 Taryn Dr
- 22402 Barcotta Dr
- 27665 Myrin Ct
- 22334 Barcotta Dr
- 27654 Taryn Dr
- 22408 Barcotta Dr