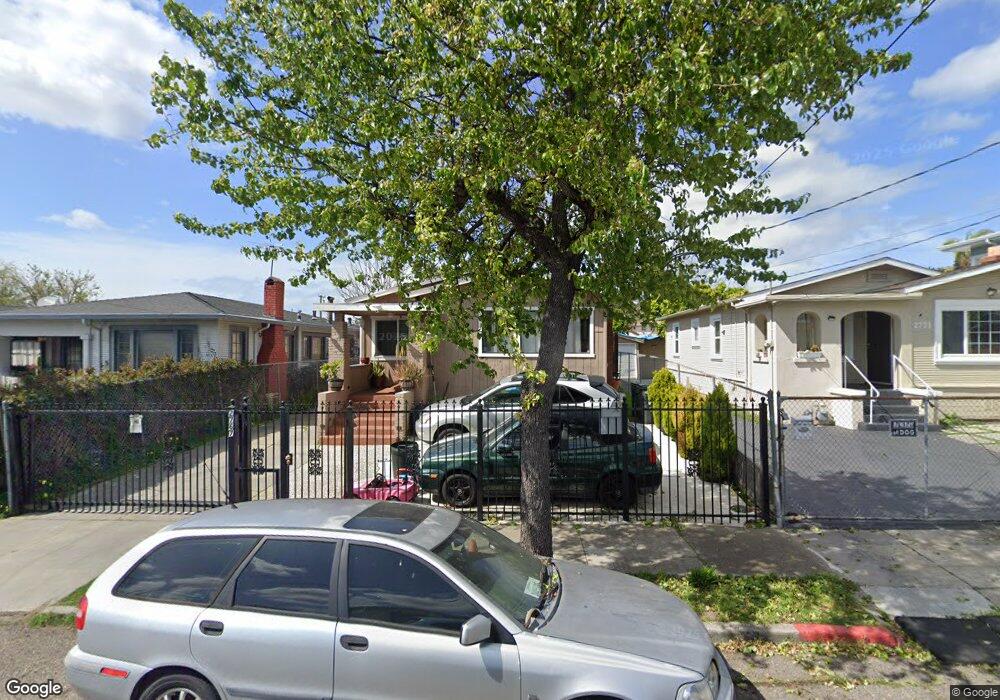
2767 79th Ave Oakland, CA 94605
Eastmont NeighborhoodEstimated Value: $389,000 - $531,762
3
Beds
1
Bath
1,203
Sq Ft
$386/Sq Ft
Est. Value
About This Home
This home is located at 2767 79th Ave, Oakland, CA 94605 and is currently estimated at $464,441, approximately $386 per square foot. 2767 79th Ave is a home located in Alameda County with nearby schools including Frick United Academy of Language, Coliseum College Prep Academy, and Madison Park Academy (6-12).
Ownership History
Date
Name
Owned For
Owner Type
Purchase Details
Closed on
Aug 30, 2013
Sold by
Alliance For Revitalized Communities Llc
Bought by
Lopez Frank Rios
Current Estimated Value
Home Financials for this Owner
Home Financials are based on the most recent Mortgage that was taken out on this home.
Original Mortgage
$142,704
Outstanding Balance
$109,448
Interest Rate
5.12%
Mortgage Type
FHA
Estimated Equity
$354,993
Purchase Details
Closed on
Aug 29, 2013
Sold by
Sanchez Evelia Rivera
Bought by
Lopez Frank Rios
Home Financials for this Owner
Home Financials are based on the most recent Mortgage that was taken out on this home.
Original Mortgage
$142,704
Outstanding Balance
$109,448
Interest Rate
5.12%
Mortgage Type
FHA
Estimated Equity
$354,993
Purchase Details
Closed on
May 29, 2013
Sold by
Federal Home Loan Mortgage Corporation
Bought by
Alliance For Revitalized Communities Llc
Home Financials for this Owner
Home Financials are based on the most recent Mortgage that was taken out on this home.
Original Mortgage
$140,000
Interest Rate
3.38%
Mortgage Type
New Conventional
Purchase Details
Closed on
May 9, 2013
Sold by
Citimortgage Inc
Bought by
Federal Home Loan Mortgage Corporation
Home Financials for this Owner
Home Financials are based on the most recent Mortgage that was taken out on this home.
Original Mortgage
$140,000
Interest Rate
3.38%
Mortgage Type
New Conventional
Purchase Details
Closed on
Mar 5, 2013
Sold by
Citimorgage Inc
Bought by
Federal Home Loan Mortgage Corporation
Purchase Details
Closed on
Dec 12, 2012
Sold by
Price Gwendolyn
Bought by
Citimortgage Inc
Purchase Details
Closed on
Nov 2, 2001
Sold by
Price Gwendolyn A and Roe Gwendolyn A
Bought by
Price Gwendolyn
Home Financials for this Owner
Home Financials are based on the most recent Mortgage that was taken out on this home.
Original Mortgage
$126,500
Interest Rate
6.62%
Purchase Details
Closed on
Jan 29, 1998
Sold by
Roe Alfred G
Bought by
Roe Gwendolyn A
Create a Home Valuation Report for This Property
The Home Valuation Report is an in-depth analysis detailing your home's value as well as a comparison with similar homes in the area
Home Values in the Area
Average Home Value in this Area
Purchase History
| Date | Buyer | Sale Price | Title Company |
|---|---|---|---|
| Lopez Frank Rios | $185,000 | Old Republic Title Company | |
| Lopez Frank Rios | -- | Old Republic Title Company | |
| Alliance For Revitalized Communities Llc | $120,000 | Old Republic Title Company | |
| Federal Home Loan Mortgage Corporation | -- | Accommodation | |
| Federal Home Loan Mortgage Corporation | -- | None Available | |
| Citimortgage Inc | $167,418 | Accommodation | |
| Price Gwendolyn | -- | Fidelity National Title Co | |
| Roe Gwendolyn A | -- | -- |
Source: Public Records
Mortgage History
| Date | Status | Borrower | Loan Amount |
|---|---|---|---|
| Open | Lopez Frank Rios | $142,704 | |
| Previous Owner | Alliance For Revitalized Communities Llc | $140,000 | |
| Previous Owner | Price Gwendolyn | $126,500 |
Source: Public Records
Tax History
| Year | Tax Paid | Tax Assessment Tax Assessment Total Assessment is a certain percentage of the fair market value that is determined by local assessors to be the total taxable value of land and additions on the property. | Land | Improvement |
|---|---|---|---|---|
| 2025 | $4,768 | $219,774 | $68,032 | $158,742 |
| 2024 | $4,768 | $215,328 | $66,698 | $155,630 |
| 2023 | $4,892 | $217,970 | $65,391 | $152,579 |
| 2022 | $4,584 | $206,697 | $64,109 | $149,588 |
| 2021 | $4,266 | $202,508 | $62,852 | $146,656 |
| 2020 | $4,215 | $207,360 | $62,208 | $145,152 |
| 2019 | $3,983 | $203,295 | $60,988 | $142,307 |
| 2018 | $3,898 | $199,311 | $59,793 | $139,518 |
| 2017 | $3,721 | $195,404 | $58,621 | $136,783 |
| 2016 | $3,526 | $191,572 | $57,471 | $134,101 |
| 2015 | $3,501 | $188,695 | $56,608 | $132,087 |
| 2014 | $3,405 | $185,000 | $55,500 | $129,500 |
Source: Public Records
Map
Nearby Homes
- 2714 79th Ave
- 2681 79th Ave
- 8016 Macarthur Blvd
- 8117 Ney Ave
- 7625 Hillside St
- 3000 Partridge Ave
- 7807 Outlook Ave
- 8301 Macarthur Blvd
- 2353 83rd Ave
- 3025 Partridge Ave
- 7700 Garfield Ave
- 2527 84th Ave
- 8311 Macarthur Blvd
- 7876 Bancroft Ave
- 0 Bancroft Ave
- 2504 78th Ave
- 8301 Ney Ave
- 2612 75th Ave
- 7565 Hillmont Dr
- 2218 82nd Ave
Your Personal Tour Guide
Ask me questions while you tour the home.