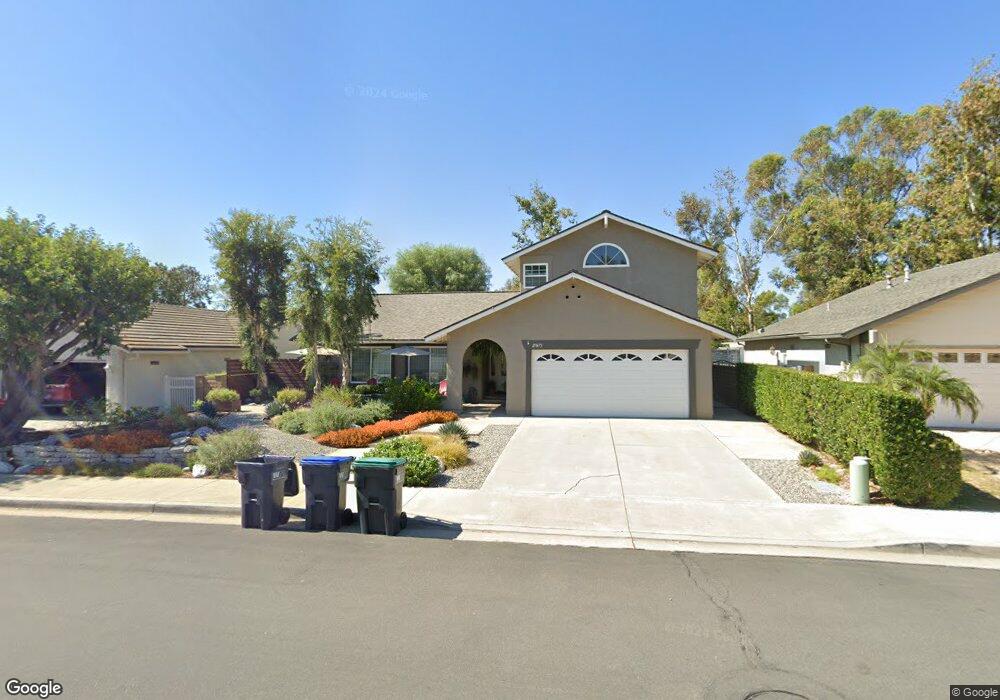
27671 Nopales Mission Viejo, CA 92692
Estimated Value: $1,253,000 - $1,426,000
4
Beds
3
Baths
2,148
Sq Ft
$622/Sq Ft
Est. Value
About This Home
This home is located at 27671 Nopales, Mission Viejo, CA 92692 and is currently estimated at $1,336,897, approximately $622 per square foot. 27671 Nopales is a home located in Orange County with nearby schools including Castille Elementary School, Newhart Middle School, and Capistrano Valley High School.
Ownership History
Date
Name
Owned For
Owner Type
Purchase Details
Closed on
Oct 21, 2020
Sold by
Folwell Daniel E and Scott Susan E
Bought by
Folwell Daniel Evan and Scott Susan Elizabeth
Current Estimated Value
Purchase Details
Closed on
Mar 22, 2002
Sold by
Fox David M and Fox Janice
Bought by
Folwell Daniel E and Scott Susan E
Home Financials for this Owner
Home Financials are based on the most recent Mortgage that was taken out on this home.
Original Mortgage
$344,000
Outstanding Balance
$138,024
Interest Rate
6.5%
Estimated Equity
$1,198,873
Purchase Details
Closed on
Dec 2, 1996
Sold by
Benjamin Levy and Benjamin Naomi
Bought by
Fox David M and Fox Janice
Home Financials for this Owner
Home Financials are based on the most recent Mortgage that was taken out on this home.
Original Mortgage
$182,800
Interest Rate
7.53%
Create a Home Valuation Report for This Property
The Home Valuation Report is an in-depth analysis detailing your home's value as well as a comparison with similar homes in the area
Home Values in the Area
Average Home Value in this Area
Purchase History
| Date | Buyer | Sale Price | Title Company |
|---|---|---|---|
| Folwell Daniel Evan | -- | None Available | |
| Folwell Daniel E | $430,000 | First American Title Co | |
| Fox David M | $188,500 | Fidelity National Title Ins |
Source: Public Records
Mortgage History
| Date | Status | Borrower | Loan Amount |
|---|---|---|---|
| Open | Folwell Daniel E | $344,000 | |
| Previous Owner | Fox David M | $182,800 |
Source: Public Records
Tax History Compared to Growth
Tax History
| Year | Tax Paid | Tax Assessment Tax Assessment Total Assessment is a certain percentage of the fair market value that is determined by local assessors to be the total taxable value of land and additions on the property. | Land | Improvement |
|---|---|---|---|---|
| 2025 | $6,249 | $635,228 | $468,023 | $167,205 |
| 2024 | $6,249 | $622,773 | $458,846 | $163,927 |
| 2023 | $6,116 | $610,562 | $449,849 | $160,713 |
| 2022 | $5,998 | $598,591 | $441,029 | $157,562 |
| 2021 | $5,881 | $586,854 | $432,381 | $154,473 |
| 2020 | $5,822 | $580,837 | $427,947 | $152,890 |
| 2019 | $5,706 | $569,449 | $419,556 | $149,893 |
| 2018 | $5,595 | $558,284 | $411,330 | $146,954 |
| 2017 | $5,484 | $547,338 | $403,265 | $144,073 |
| 2016 | $5,378 | $536,606 | $395,357 | $141,249 |
| 2015 | $5,313 | $528,546 | $389,418 | $139,128 |
| 2014 | $5,210 | $518,193 | $381,790 | $136,403 |
Source: Public Records
Map
Nearby Homes
- 27643 Via Granados
- 27951 Faroles
- 27641 Ruisenor
- 27911 Sheffield
- 24362 Via Santa Clara
- 27661 Pasatiempo
- 25145 Darlington
- 27724 Calle Valdes
- 25091 Cheshire
- 24392 Macedo Dr
- 27748 Via Sarasate
- 27695 Via Turina
- 25 Mirino Dr
- 27798 Espinoza
- 27858 Via Sarasate
- 27382 Via Cortez
- 27942 Via Granados
- 27843 Espinoza
- 25311 Misty Ridge
- 27865 Espinoza
- 27681 Nopales
- 27661 Nopales
- 27691 Nopales
- 27655 Nopales
- 27672 Nopales
- 27662 Nopales
- 27682 Nopales
- 27695 Nopales
- 27651 Nopales
- 27692 Nopales
- 0 Del Obispo Unit P774059
- 27694 Nopales
- 24761 Riendas
- 27701 Nopales
- 27715 Golondrina
- 27711 Golondrina
- 27645 Nopales
- 27721 Golondrina
- 24771 Riendas
- 27702 Nopales