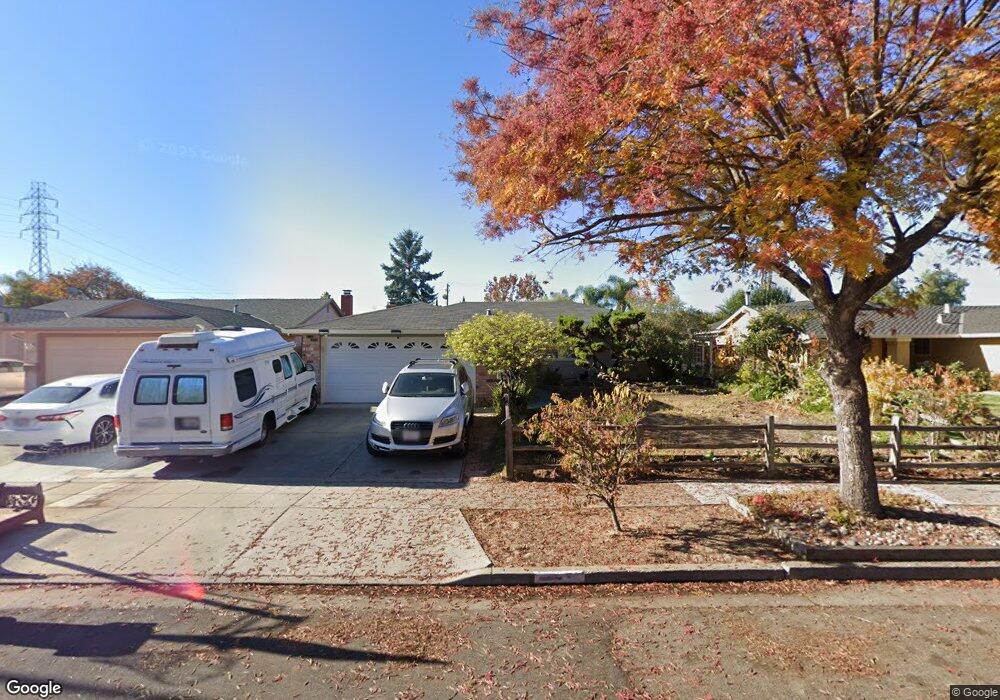
2769 Kern Ave San Jose, CA 95121
Stonegate NeighborhoodEstimated Value: $1,133,190 - $1,323,000
3
Beds
2
Baths
1,444
Sq Ft
$862/Sq Ft
Est. Value
About This Home
This home is located at 2769 Kern Ave, San Jose, CA 95121 and is currently estimated at $1,244,548, approximately $861 per square foot. 2769 Kern Ave is a home located in Santa Clara County with nearby schools including Windmill Springs Elementary School, Sylvandale Middle School, and Yerba Buena High School.
Ownership History
Date
Name
Owned For
Owner Type
Purchase Details
Closed on
Jun 14, 2010
Sold by
Tran Canh M
Bought by
Tran Hue
Current Estimated Value
Home Financials for this Owner
Home Financials are based on the most recent Mortgage that was taken out on this home.
Original Mortgage
$311,250
Interest Rate
4.91%
Mortgage Type
New Conventional
Purchase Details
Closed on
Apr 26, 2010
Sold by
Hsbc Bank Usa National Association
Bought by
Tran Hue
Home Financials for this Owner
Home Financials are based on the most recent Mortgage that was taken out on this home.
Original Mortgage
$311,250
Interest Rate
4.91%
Mortgage Type
New Conventional
Purchase Details
Closed on
Jan 12, 2010
Sold by
Ryan Daniel
Bought by
Hsbc Bank Usa National Association
Purchase Details
Closed on
Nov 28, 2006
Sold by
Guzman Ramiro D and Guzman Dolores
Bought by
Ryan Daniel
Home Financials for this Owner
Home Financials are based on the most recent Mortgage that was taken out on this home.
Original Mortgage
$145,000
Interest Rate
6.32%
Mortgage Type
Stand Alone Second
Purchase Details
Closed on
Apr 12, 2002
Sold by
Guzman Ramiro D and Guzman Dolores
Bought by
Guzman Ramiro D and Guzman Dolores
Create a Home Valuation Report for This Property
The Home Valuation Report is an in-depth analysis detailing your home's value as well as a comparison with similar homes in the area
Home Values in the Area
Average Home Value in this Area
Purchase History
| Date | Buyer | Sale Price | Title Company |
|---|---|---|---|
| Tran Hue | -- | Chicago Title Company | |
| Tran Hue | $415,000 | Chicago Title Company | |
| Hsbc Bank Usa National Association | $346,200 | Accommodation | |
| Ryan Daniel | $720,000 | Alliance Title Company | |
| Guzman Ramiro D | -- | -- |
Source: Public Records
Mortgage History
| Date | Status | Borrower | Loan Amount |
|---|---|---|---|
| Previous Owner | Tran Hue | $311,250 | |
| Previous Owner | Ryan Daniel | $145,000 | |
| Previous Owner | Ryan Daniel | $580,000 |
Source: Public Records
Tax History Compared to Growth
Tax History
| Year | Tax Paid | Tax Assessment Tax Assessment Total Assessment is a certain percentage of the fair market value that is determined by local assessors to be the total taxable value of land and additions on the property. | Land | Improvement |
|---|---|---|---|---|
| 2025 | $8,328 | $535,677 | $354,969 | $180,708 |
| 2024 | $8,328 | $525,174 | $348,009 | $177,165 |
| 2023 | $8,214 | $514,878 | $341,186 | $173,692 |
| 2022 | $8,037 | $504,784 | $334,497 | $170,287 |
| 2021 | $7,990 | $494,888 | $327,939 | $166,949 |
| 2020 | $7,714 | $489,815 | $324,577 | $165,238 |
| 2019 | $7,400 | $480,212 | $318,213 | $161,999 |
| 2018 | $7,390 | $470,797 | $311,974 | $158,823 |
| 2017 | $7,294 | $461,566 | $305,857 | $155,709 |
| 2016 | $6,936 | $452,516 | $299,860 | $152,656 |
| 2015 | $6,794 | $445,719 | $295,356 | $150,363 |
| 2014 | $6,319 | $436,989 | $289,571 | $147,418 |
Source: Public Records
Map
Nearby Homes
- 2566 Boren Dr
- 3016 Shadow Springs Place Unit 113
- 3241 Shadow Park Place
- 1051 Keldon Dr
- 3326 Shadow Park Place
- 3354 Shadow Park Place Unit 319
- 2748 Aida Ave
- 2416 Balme Dr
- 2697 Lone Bluff Way
- 1058 Tekman Dr Unit 58
- 2647 Aida Ave
- 677 Dadis Way
- 653 Dadis Way
- 1520 E Capitol Expy
- 1520 E Capitol Expy Unit 29
- 608 Balfour Dr
- 2580 Senter Rd Unit 455
- 2580 Senter Rd Unit 515
- 2681 Senter Rd
- 2570 Senter Rd
- 2761 Kern Ave
- 2777 Kern Ave
- 2770 Mclaughlin Ave
- 2762 Mclaughlin Ave
- 2785 Kern Ave
- 2778 Mclaughlin Ave
- 1158 Bellingham Dr
- 1152 Bellingham Dr
- 2786 Mclaughlin Ave
- 2776 Kern Ave
- 2750 Kern Ave
- 2791 Kern Ave
- 2784 Kern Ave
- 1174 Bellingham Dr
- 2792 Mclaughlin Ave
- 2797 Kern Ave
- 2790 Kern Ave
- 2798 Mclaughlin Ave
- 2758 Mclaughlin Ave
- 1210 Becket Dr