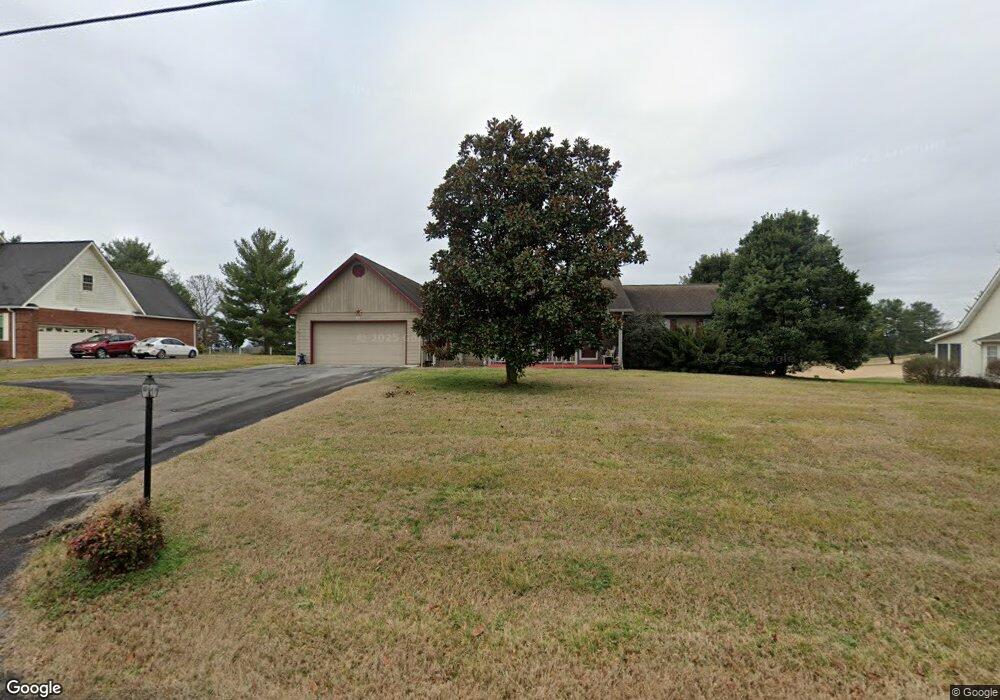
277 Battlefield Dr Dandridge, TN 37725
Estimated Value: $362,725 - $490,000
--
Bed
3
Baths
1,790
Sq Ft
$241/Sq Ft
Est. Value
About This Home
This home is located at 277 Battlefield Dr, Dandridge, TN 37725 and is currently estimated at $431,931, approximately $241 per square foot. 277 Battlefield Dr is a home located in Jefferson County with nearby schools including Mountain View Academy For Young Men.
Ownership History
Date
Name
Owned For
Owner Type
Purchase Details
Closed on
Aug 3, 2020
Sold by
Moats Carolyn L
Bought by
Moats Carolyn L and Moats Melissa A
Current Estimated Value
Home Financials for this Owner
Home Financials are based on the most recent Mortgage that was taken out on this home.
Original Mortgage
$120,000
Outstanding Balance
$106,448
Interest Rate
3%
Mortgage Type
New Conventional
Estimated Equity
$325,483
Purchase Details
Closed on
Jan 14, 2016
Sold by
Patterson Joe Denton
Bought by
Moats Carolyn L
Home Financials for this Owner
Home Financials are based on the most recent Mortgage that was taken out on this home.
Original Mortgage
$65,000
Interest Rate
3.98%
Mortgage Type
New Conventional
Purchase Details
Closed on
Jul 27, 2011
Sold by
Satterfield Darlene W
Bought by
Satterfield Darlene W and Patterson Joe Denton
Purchase Details
Closed on
Feb 4, 1992
Bought by
Satterfield Satterfield J and Satterfield Darlene W
Purchase Details
Closed on
Oct 25, 1983
Bought by
Kesterson Curtiss D and Kesterson Vicki M
Create a Home Valuation Report for This Property
The Home Valuation Report is an in-depth analysis detailing your home's value as well as a comparison with similar homes in the area
Home Values in the Area
Average Home Value in this Area
Purchase History
| Date | Buyer | Sale Price | Title Company |
|---|---|---|---|
| Moats Carolyn L | -- | Orange Coast Lender Services | |
| Moats Carolyn L | $147,000 | -- | |
| Satterfield Darlene W | -- | -- | |
| Satterfield Satterfield J | $12,500 | -- | |
| Kesterson Curtiss D | -- | -- |
Source: Public Records
Mortgage History
| Date | Status | Borrower | Loan Amount |
|---|---|---|---|
| Open | Moats Carolyn L | $120,000 | |
| Closed | Moats Carolyn L | $65,000 |
Source: Public Records
Tax History Compared to Growth
Tax History
| Year | Tax Paid | Tax Assessment Tax Assessment Total Assessment is a certain percentage of the fair market value that is determined by local assessors to be the total taxable value of land and additions on the property. | Land | Improvement |
|---|---|---|---|---|
| 2025 | $1,211 | $84,675 | $12,500 | $72,175 |
| 2023 | $1,173 | $51,000 | $0 | $0 |
| 2022 | $1,117 | $51,000 | $10,000 | $41,000 |
| 2021 | $1,117 | $51,000 | $10,000 | $41,000 |
| 2020 | $1,117 | $51,000 | $10,000 | $41,000 |
| 2019 | $1,117 | $51,000 | $10,000 | $41,000 |
| 2018 | $1,070 | $45,525 | $8,000 | $37,525 |
| 2017 | $1,070 | $45,525 | $8,000 | $37,525 |
| 2016 | $1,070 | $45,525 | $8,000 | $37,525 |
| 2015 | $1,070 | $45,525 | $8,000 | $37,525 |
| 2014 | $1,070 | $45,525 | $8,000 | $37,525 |
Source: Public Records
Map
Nearby Homes
- 271 Battlefield Dr
- 281 Battlefield Dr
- 278 Battlefield Dr
- 285 Battlefield Dr
- 265 Battlefield Dr
- 274 Battlefield Dr
- Lot 57 & 58 Battlefield Dr
- Lot 59 Battlefield Dr
- 255 Battlefield Dr
- 270 Battlefield Dr
- 284 Battlefield Dr
- 295 Battlefield Dr
- 379 Battlefield Dr
- Lot 58 Battlefield Dr
- Lot 57 Battlefield Dr
- 249 Battlefield Dr
- 294 Battlefield Dr
- 246 Battlefield Dr
- 376 Battlefield Dr
- 296 Battlefield Dr