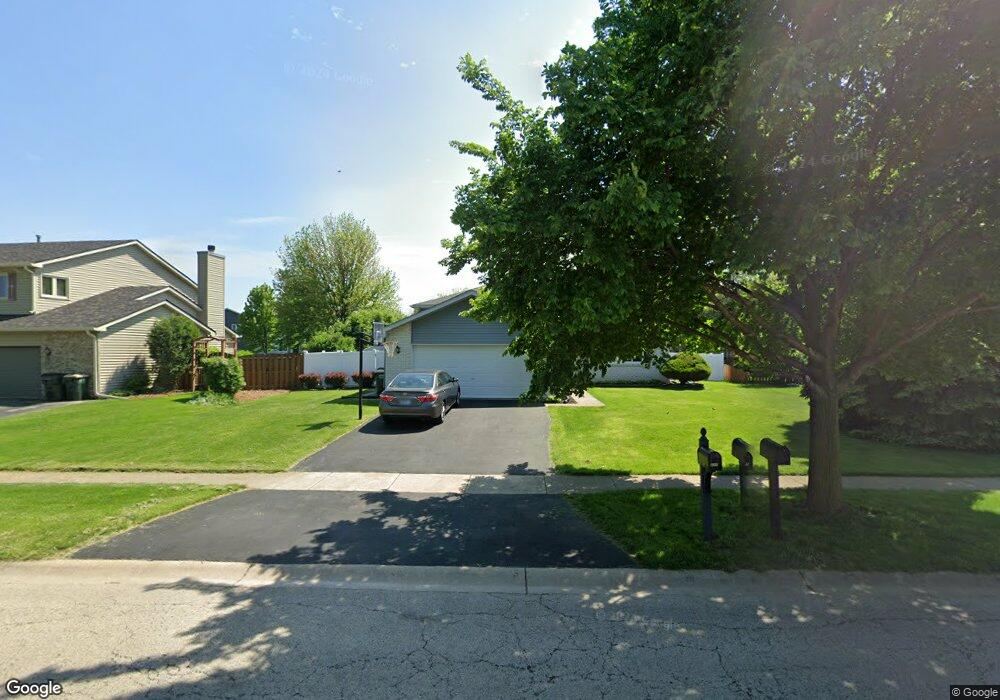
277 Fox Chase Dr N Oswego, IL 60543
Northwest Oswego NeighborhoodEstimated Value: $342,000 - $362,000
3
Beds
2
Baths
1,171
Sq Ft
$299/Sq Ft
Est. Value
About This Home
This home is located at 277 Fox Chase Dr N, Oswego, IL 60543 and is currently estimated at $350,138, approximately $299 per square foot. 277 Fox Chase Dr N is a home located in Kendall County with nearby schools including Fox Chase Elementary School, Traughber Junior High School, and Oswego High School.
Ownership History
Date
Name
Owned For
Owner Type
Purchase Details
Closed on
Aug 2, 2002
Sold by
Fredricks Randy
Bought by
Fredricks Randy and Fredricks Tomomi
Current Estimated Value
Purchase Details
Closed on
May 21, 2002
Sold by
Neitzer Michael J
Bought by
Fredricks Randy E
Home Financials for this Owner
Home Financials are based on the most recent Mortgage that was taken out on this home.
Original Mortgage
$144,000
Outstanding Balance
$56,193
Interest Rate
7%
Estimated Equity
$293,945
Purchase Details
Closed on
Jul 17, 1997
Sold by
Leachman Kenneth A and Leachman Michelle A
Bought by
Neitzer Michael J
Home Financials for this Owner
Home Financials are based on the most recent Mortgage that was taken out on this home.
Original Mortgage
$121,600
Interest Rate
7.94%
Purchase Details
Closed on
May 26, 1995
Bought by
Leachman Kenneth A and Leachman Michelle
Create a Home Valuation Report for This Property
The Home Valuation Report is an in-depth analysis detailing your home's value as well as a comparison with similar homes in the area
Home Values in the Area
Average Home Value in this Area
Purchase History
We collect this data history from publicly available records. To have your information removed, we recommend requesting removal directly through your county’s website.
| Date | Buyer | Sale Price | Title Company |
|---|---|---|---|
| Fredricks Randy | -- | -- | |
| Fredricks Randy E | $180,000 | Law Title Insurance Co Inc | |
| Neitzer Michael J | $152,500 | Law Title Insurance Co | |
| Leachman Kenneth A | $133,900 | -- |
Source: Public Records
Mortgage History
We collect this data history from publicly available records. To have your information removed, we recommend requesting removal directly through your county’s website.
| Date | Status | Borrower | Loan Amount |
|---|---|---|---|
| Open | Fredricks Randy E | $144,000 | |
| Previous Owner | Neitzer Michael J | $121,600 | |
| Closed | Leachman Kenneth A | -- |
Source: Public Records
Tax History
| Year | Tax Paid | Tax Assessment Tax Assessment Total Assessment is a certain percentage of the fair market value that is determined by local assessors to be the total taxable value of land and additions on the property. | Land | Improvement |
|---|---|---|---|---|
| 2024 | $6,849 | $93,604 | $14,485 | $79,119 |
| 2023 | $6,156 | $83,575 | $12,933 | $70,642 |
| 2022 | $6,156 | $76,674 | $11,865 | $64,809 |
| 2021 | $6,037 | $73,023 | $11,300 | $61,723 |
| 2020 | $6,028 | $72,300 | $11,188 | $61,112 |
| 2019 | $5,690 | $67,773 | $11,188 | $56,585 |
| 2018 | $5,425 | $66,634 | $11,000 | $55,634 |
| 2017 | $5,040 | $57,663 | $6,623 | $51,040 |
| 2016 | $5,167 | $58,175 | $17,007 | $41,168 |
| 2015 | $4,790 | $52,410 | $15,322 | $37,088 |
| 2014 | -- | $49,444 | $14,455 | $34,989 |
| 2013 | -- | $49,943 | $14,601 | $35,342 |
Source: Public Records
Map
Nearby Homes
- 303 Owen Ct
- 628 Manhattan Cir Unit 2
- 205 Willowwood Dr
- 328 Ash Grove Ln
- 1900 Light Rd Unit 210
- 123 Eisenhower Dr
- 1415 State Route 31
- 604 Roosevelt Dr Unit 3
- 2400 Light Rd Unit 112
- 186 River Mist Dr
- 241 W Washington St Unit 3273
- 116 River Mist Dr
- 133 River Mist Dr Unit 3
- 176 Presidential Blvd
- 2110 State Route 31
- 106 River Run Ct
- 115 Harbor Dr
- 7.43 Acres Vacant La State Route 31
- 130 W Harvest Ct
- 219 Wolverine Dr Unit 8
- 279 Fox Chase Dr N
- 275 Fox Chase Dr N Unit 4
- 413 Beaver Ct
- 415 Beaver Ct
- 281 Fox Chase Dr N
- 273 Fox Chase Dr N
- 278 Fox Chase Dr N
- 280 Fox Chase Dr N
- 276 Fox Chase Dr N
- 411 Beaver Ct Unit 3
- 282 Fox Chase Dr N
- 271 Fox Chase Dr N
- 404 Bobcat Ct
- 283 Fox Chase Dr N
- 412 Beaver Ct
- 274 Fox Chase Dr N
- 406 Bobcat Ct
- 284 Fox Chase Dr N
- 714 Manhattan Cir
- 409 Beaver Ct
Your Personal Tour Guide
Ask me questions while you tour the home.