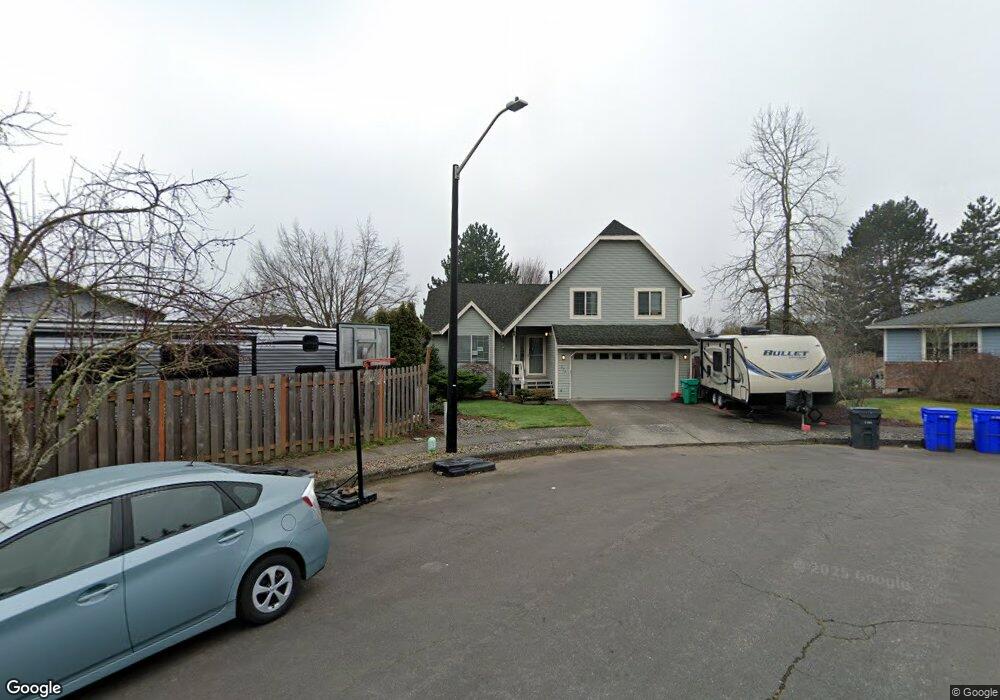
277 SW Lillyben Ave Gresham, OR 97080
Hollybrook NeighborhoodEstimated Value: $435,000 - $462,000
3
Beds
2
Baths
1,494
Sq Ft
$303/Sq Ft
Est. Value
About This Home
This home is located at 277 SW Lillyben Ave, Gresham, OR 97080 and is currently estimated at $452,378, approximately $302 per square foot. 277 SW Lillyben Ave is a home located in Multnomah County with nearby schools including Hollydale Elementary School, Clear Creek Middle School, and Gresham High School.
Ownership History
Date
Name
Owned For
Owner Type
Purchase Details
Closed on
Apr 1, 2010
Sold by
Linch James A
Bought by
Skyles Sarah and Skyles Adam
Current Estimated Value
Home Financials for this Owner
Home Financials are based on the most recent Mortgage that was taken out on this home.
Original Mortgage
$218,469
Outstanding Balance
$142,352
Interest Rate
4.88%
Mortgage Type
FHA
Estimated Equity
$310,026
Purchase Details
Closed on
Apr 3, 1998
Sold by
Weinard Ronald E
Bought by
Linch James A and Linch Michele K
Home Financials for this Owner
Home Financials are based on the most recent Mortgage that was taken out on this home.
Original Mortgage
$127,760
Interest Rate
7%
Mortgage Type
Purchase Money Mortgage
Purchase Details
Closed on
Sep 18, 1995
Sold by
Schmidt Hans R
Bought by
Weinard Ronald E and Weinard Christie
Home Financials for this Owner
Home Financials are based on the most recent Mortgage that was taken out on this home.
Original Mortgage
$124,100
Interest Rate
7.88%
Mortgage Type
Purchase Money Mortgage
Create a Home Valuation Report for This Property
The Home Valuation Report is an in-depth analysis detailing your home's value as well as a comparison with similar homes in the area
Home Values in the Area
Average Home Value in this Area
Purchase History
| Date | Buyer | Sale Price | Title Company |
|---|---|---|---|
| Skyles Sarah | $222,500 | Chicago Title Ins Company Or | |
| Linch James A | $159,700 | Oregon Title Insurance Co | |
| Weinard Ronald E | $137,900 | Ticor Title Insurance |
Source: Public Records
Mortgage History
| Date | Status | Borrower | Loan Amount |
|---|---|---|---|
| Open | Skyles Sarah | $218,469 | |
| Previous Owner | Linch James A | $127,760 | |
| Previous Owner | Weinard Ronald E | $124,100 |
Source: Public Records
Tax History
| Year | Tax Paid | Tax Assessment Tax Assessment Total Assessment is a certain percentage of the fair market value that is determined by local assessors to be the total taxable value of land and additions on the property. | Land | Improvement |
|---|---|---|---|---|
| 2025 | $5,090 | $250,120 | -- | -- |
| 2024 | $4,872 | $242,840 | -- | -- |
| 2023 | $4,439 | $235,770 | $0 | $0 |
| 2022 | $4,315 | $228,910 | $0 | $0 |
| 2021 | $4,206 | $222,250 | $0 | $0 |
| 2020 | $3,958 | $215,780 | $0 | $0 |
| 2019 | $3,854 | $209,500 | $0 | $0 |
| 2018 | $3,675 | $203,400 | $0 | $0 |
| 2017 | $3,526 | $197,480 | $0 | $0 |
| 2016 | $3,109 | $191,730 | $0 | $0 |
Source: Public Records
Map
Nearby Homes
- 44 SW Birdsdale Dr
- 21 NW Mawrcrest Ave
- 63 NW Mawrcrest Ave
- 85 NW Mawrcrest Ave
- 181 NW Mawrcrest Ave
- 185 NW Mawrcrest Ave
- 230 NW Mawrcrest Ave
- 236 NW Mawrcrest Ave
- 256 NW Mawrcrest Ave
- 296 NW Mawrcrest Ave
- 284 NW Mawrcrest Ave
- 2543 NW 2nd Terrace
- 2590 NW 2nd Terrace
- 2095 NW 3rd St
- 163 SW Sandlewood Loop
- 3412 NW 1st St
- 1745 NW 7th Place
- 1960 SW 13th Ct
- 765 NW Angeline Ave
- 1113 W Powell Blvd
- 269 SW Lillyben Ave
- 281 SW Lillyben Ave
- 2301 SW 3rd St
- 2321 SW 3rd St
- 278 SW Mawrcrest Ave
- 2231 SW 3rd St
- 268 SW Mawrcrest Ave
- 288 SW Mawrcrest Ave
- 241 SW Lillyben Ave
- 229 SW Lillyben Ave
- 238 SW Mawrcrest Ave
- 278 SW Lillyben Ave
- 288 SW Lillyben Ave
- 2302 SW 3rd St
- 268 SW Lillyben Ave
- 2312 SW 3rd St
- 2232 SW 3rd St
- 271 SW Mawrcrest Ave
- 2370 SW 1st St
- 2380 SW 1st St
Your Personal Tour Guide
Ask me questions while you tour the home.