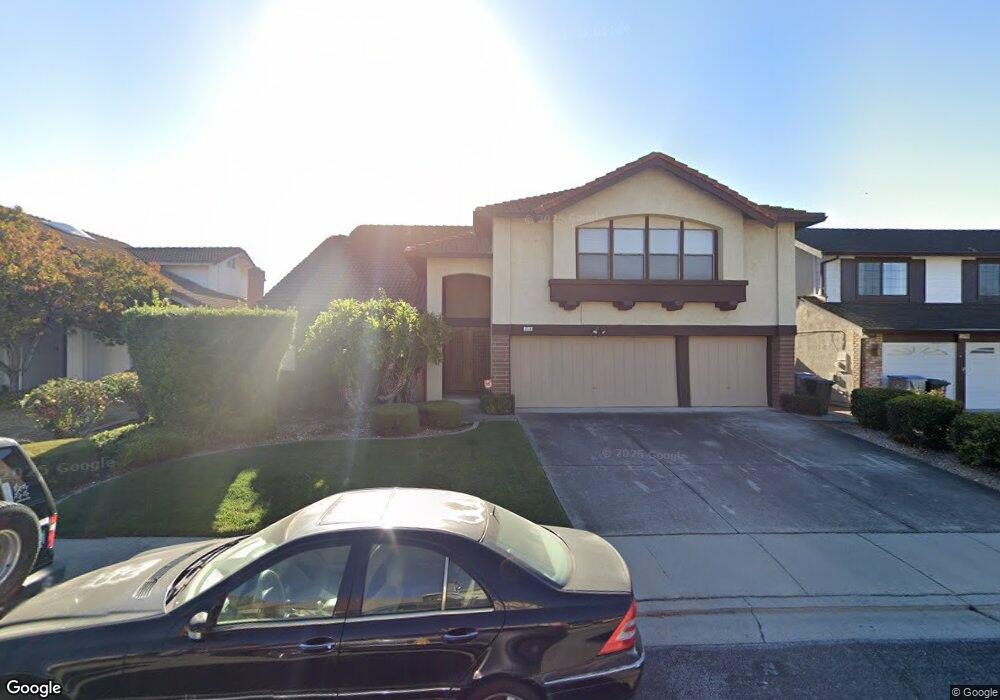
2778 Boncheff Dr San Jose, CA 95133
Penitencia NeighborhoodEstimated Value: $1,816,875 - $2,187,000
4
Beds
3
Baths
3,151
Sq Ft
$633/Sq Ft
Est. Value
About This Home
This home is located at 2778 Boncheff Dr, San Jose, CA 95133 and is currently estimated at $1,995,719, approximately $633 per square foot. 2778 Boncheff Dr is a home located in Santa Clara County with nearby schools including Summerdale Elementary School, Piedmont Middle School, and Independence High School.
Ownership History
Date
Name
Owned For
Owner Type
Purchase Details
Closed on
Feb 24, 2012
Sold by
Fritz Raymond M
Bought by
Derbingy Llc
Current Estimated Value
Purchase Details
Closed on
Oct 4, 2011
Sold by
Derbingy Llc
Bought by
Fritz Raymond M
Purchase Details
Closed on
Jul 22, 2009
Sold by
Fritz Raymond M
Bought by
Derbigny Llc
Purchase Details
Closed on
May 17, 2000
Sold by
Fritz Raymond M
Bought by
Fritz Raymond M
Create a Home Valuation Report for This Property
The Home Valuation Report is an in-depth analysis detailing your home's value as well as a comparison with similar homes in the area
Home Values in the Area
Average Home Value in this Area
Purchase History
| Date | Buyer | Sale Price | Title Company |
|---|---|---|---|
| Derbingy Llc | -- | None Available | |
| Fritz Raymond M | -- | None Available | |
| Derbigny Llc | -- | None Available | |
| Fritz Raymond M | -- | -- |
Source: Public Records
Tax History Compared to Growth
Tax History
| Year | Tax Paid | Tax Assessment Tax Assessment Total Assessment is a certain percentage of the fair market value that is determined by local assessors to be the total taxable value of land and additions on the property. | Land | Improvement |
|---|---|---|---|---|
| 2025 | $7,992 | $468,034 | $163,802 | $304,232 |
| 2024 | $7,992 | $458,858 | $160,591 | $298,267 |
| 2023 | $7,818 | $449,862 | $157,443 | $292,419 |
| 2022 | $7,760 | $441,042 | $154,356 | $286,686 |
| 2021 | $7,468 | $432,395 | $151,330 | $281,065 |
| 2020 | $7,161 | $427,963 | $149,779 | $278,184 |
| 2019 | $6,866 | $419,573 | $146,843 | $272,730 |
| 2018 | $6,747 | $411,347 | $143,964 | $267,383 |
| 2017 | $6,761 | $403,283 | $141,142 | $262,141 |
| 2016 | $6,482 | $395,376 | $138,375 | $257,001 |
| 2015 | $6,407 | $389,438 | $136,297 | $253,141 |
| 2014 | $5,421 | $381,811 | $133,628 | $248,183 |
Source: Public Records
Map
Nearby Homes
- 2806 Glauser Dr
- 2714 Mabury Square
- 2598 Mabury Square
- 825 N Capitol Ave Unit 4
- 714 N Capitol Ave
- 693 Kirk Glen Dr
- 994 Harcot Ct
- 981 Harcot Ct
- 982 Harcot Ct
- 997 Harcot Ct
- 998 Harcot Ct
- 673 Kirk Glen Dr
- 931 ToMcOt Ct
- 990 Harcot Ct
- 674 Galleon Ct
- 970 E Harcot Ct
- Residence 2 Plan at Ascend
- Residence 1 Plan at Ascend
- Residence 3 Plan at Ascend
- 2623 Gimelli Place Unit 139
- 2782 Boncheff Dr
- 2774 Boncheff Dr
- 2779 Glen Firth Dr
- 2775 Glen Firth Dr
- 2786 Boncheff Dr
- 2770 Boncheff Dr
- 2785 Glen Firth Dr
- 2769 Glen Firth Dr
- 2777 Boncheff Dr
- 2773 Boncheff Dr
- 2781 Boncheff Dr
- 2766 Boncheff Dr
- 2790 Boncheff Dr
- 2789 Glen Firth Dr
- 2765 Glen Firth Dr
- 2769 Boncheff Dr
- 2785 Boncheff Dr
- 2795 Glen Firth Dr
- 2765 Boncheff Dr
- 2789 Boncheff Dr