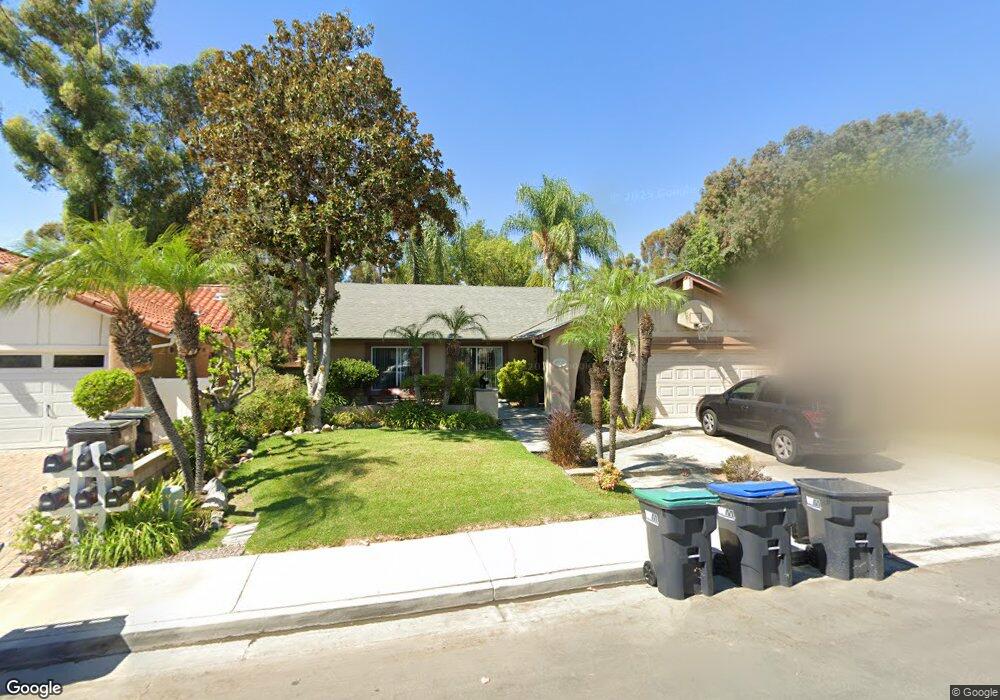
27795 Abadejo Mission Viejo, CA 92692
Estimated Value: $1,103,989 - $1,259,000
3
Beds
2
Baths
1,376
Sq Ft
$849/Sq Ft
Est. Value
About This Home
This home is located at 27795 Abadejo, Mission Viejo, CA 92692 and is currently estimated at $1,168,497, approximately $849 per square foot. 27795 Abadejo is a home located in Orange County with nearby schools including Castille Elementary School, Newhart Middle School, and Capistrano Valley High School.
Ownership History
Date
Name
Owned For
Owner Type
Purchase Details
Closed on
Dec 29, 2014
Sold by
Gray Rick and Gray Carolyn M
Bought by
The Gray Family Trust
Current Estimated Value
Home Financials for this Owner
Home Financials are based on the most recent Mortgage that was taken out on this home.
Original Mortgage
$422,450
Outstanding Balance
$323,936
Interest Rate
3.87%
Mortgage Type
New Conventional
Estimated Equity
$844,561
Purchase Details
Closed on
Dec 14, 2004
Sold by
Gray Richard Lee and Gray Carolyn Marie
Bought by
Gray Rick and Gray Carolyn M
Purchase Details
Closed on
Jul 16, 1997
Sold by
Gennaro Mark A and Gennaro Tania
Bought by
Gray Richard Lee and Gray Carolyn Marie
Home Financials for this Owner
Home Financials are based on the most recent Mortgage that was taken out on this home.
Original Mortgage
$197,350
Interest Rate
7.42%
Create a Home Valuation Report for This Property
The Home Valuation Report is an in-depth analysis detailing your home's value as well as a comparison with similar homes in the area
Home Values in the Area
Average Home Value in this Area
Purchase History
| Date | Buyer | Sale Price | Title Company |
|---|---|---|---|
| The Gray Family Trust | -- | First American Title | |
| Gray Rick | -- | -- | |
| Gray Richard Lee | $203,500 | Fidelity National Title Ins |
Source: Public Records
Mortgage History
| Date | Status | Borrower | Loan Amount |
|---|---|---|---|
| Open | The Gray Family Trust | $422,450 | |
| Previous Owner | Gray Richard Lee | $197,350 |
Source: Public Records
Tax History Compared to Growth
Tax History
| Year | Tax Paid | Tax Assessment Tax Assessment Total Assessment is a certain percentage of the fair market value that is determined by local assessors to be the total taxable value of land and additions on the property. | Land | Improvement |
|---|---|---|---|---|
| 2025 | $3,172 | $324,926 | $172,331 | $152,595 |
| 2024 | $3,172 | $318,555 | $168,952 | $149,603 |
| 2023 | $3,104 | $312,309 | $165,639 | $146,670 |
| 2022 | $3,043 | $306,186 | $162,391 | $143,795 |
| 2021 | $2,983 | $300,183 | $159,207 | $140,976 |
| 2020 | $2,953 | $297,105 | $157,574 | $139,531 |
| 2019 | $2,894 | $291,280 | $154,484 | $136,796 |
| 2018 | $2,837 | $285,569 | $151,455 | $134,114 |
| 2017 | $2,780 | $279,970 | $148,485 | $131,485 |
| 2016 | $2,725 | $274,481 | $145,574 | $128,907 |
| 2015 | $2,700 | $270,359 | $143,388 | $126,971 |
| 2014 | $2,647 | $265,064 | $140,580 | $124,484 |
Source: Public Records
Map
Nearby Homes
- 27751 Via Granados
- 27643 Via Granados
- 27951 Faroles
- 27748 Via Sarasate
- 24362 Via Santa Clara
- 27858 Via Sarasate
- 27798 Espinoza
- 27695 Via Turina
- 27942 Via Granados
- 27865 Espinoza
- 27911 Sheffield
- 27876 Torroba
- 27382 Via Cortez
- 24392 Macedo Dr
- 27705 Via Rodrigo
- 25091 Cheshire
- 24375 Macedo Dr
- 25145 Darlington
- 27641 Ruisenor
- 27701 Pasatiempo