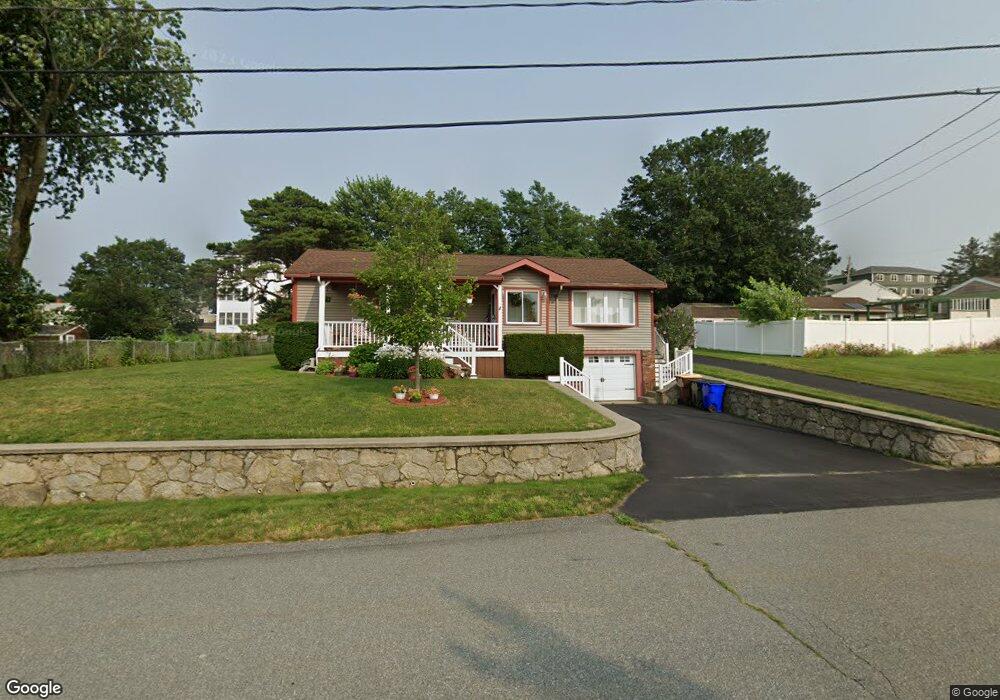
278 Bayview St Fall River, MA 02724
Sandy Beach NeighborhoodEstimated Value: $495,584 - $623,000
3
Beds
1
Bath
2,481
Sq Ft
$219/Sq Ft
Est. Value
About This Home
This home is located at 278 Bayview St, Fall River, MA 02724 and is currently estimated at $542,146, approximately $218 per square foot. 278 Bayview St is a home located in Bristol County with nearby schools including Carlton M. Viveiros Elementary School, Matthew J. Kuss Middle School, and B M C Durfee High School.
Ownership History
Date
Name
Owned For
Owner Type
Purchase Details
Closed on
Jan 13, 2016
Sold by
Grace William F and Grace Jacqueline A
Bought by
Grace William F and Cawthorn Cheryl L
Current Estimated Value
Purchase Details
Closed on
Aug 4, 2015
Sold by
Grace William F and Grace Jacqueline A
Bought by
Grace William F and Cawthorn Cheryl L
Purchase Details
Closed on
Jan 13, 1975
Bought by
Grace William F and Cawthorn Cheryl L
Create a Home Valuation Report for This Property
The Home Valuation Report is an in-depth analysis detailing your home's value as well as a comparison with similar homes in the area
Home Values in the Area
Average Home Value in this Area
Purchase History
| Date | Buyer | Sale Price | Title Company |
|---|---|---|---|
| Grace William F | -- | -- | |
| Grace William F | -- | -- | |
| Grace William F | -- | -- |
Source: Public Records
Mortgage History
| Date | Status | Borrower | Loan Amount |
|---|---|---|---|
| Previous Owner | Grace William F | $25,000 |
Source: Public Records
Tax History
| Year | Tax Paid | Tax Assessment Tax Assessment Total Assessment is a certain percentage of the fair market value that is determined by local assessors to be the total taxable value of land and additions on the property. | Land | Improvement |
|---|---|---|---|---|
| 2025 | $4,808 | $419,900 | $133,200 | $286,700 |
| 2024 | $4,543 | $395,400 | $130,600 | $264,800 |
| 2023 | $4,509 | $367,500 | $117,700 | $249,800 |
| 2022 | $4,035 | $319,700 | $111,000 | $208,700 |
| 2021 | $8,158 | $282,200 | $106,100 | $176,100 |
| 2020 | $7,706 | $260,800 | $101,200 | $159,600 |
| 2019 | $8,775 | $256,600 | $105,800 | $150,800 |
| 2018 | $6,884 | $249,300 | $106,600 | $142,700 |
| 2017 | $3,465 | $247,500 | $106,600 | $140,900 |
| 2016 | $3,349 | $245,700 | $109,900 | $135,800 |
| 2015 | $3,195 | $244,300 | $109,900 | $134,400 |
| 2014 | $3,073 | $244,300 | $109,900 | $134,400 |
Source: Public Records
Map
Nearby Homes
Your Personal Tour Guide
Ask me questions while you tour the home.