Estimated Value: $175,862 - $215,000
4
Beds
1
Bath
1,848
Sq Ft
$106/Sq Ft
Est. Value
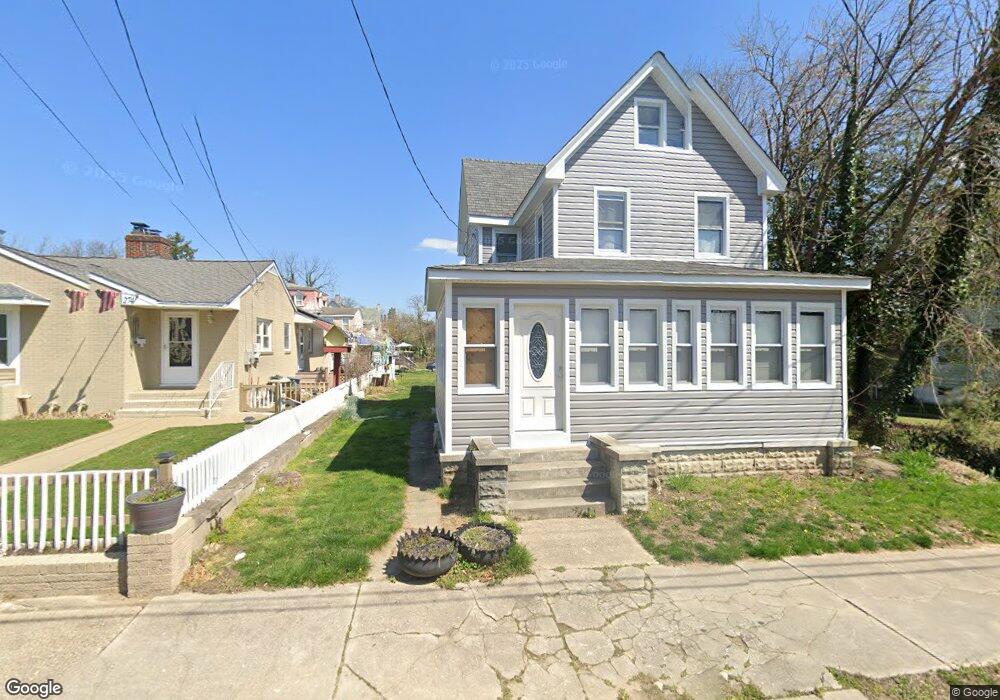
About This Home
This home is located at 278 Grant St, Salem, NJ 08079 and is currently estimated at $196,466, approximately $106 per square foot. 278 Grant St is a home located in Salem County with nearby schools including John Fenwick Elementary School, Salem Middle School, and Salem High School.
Ownership History
Date
Name
Owned For
Owner Type
Purchase Details
Closed on
May 18, 2021
Sold by
City Of Salem
Bought by
Lorainey Brian
Current Estimated Value
Purchase Details
Closed on
Mar 7, 2017
Sold by
Empire Tf4 Jersey Holdings Llc
Bought by
Abj Llc
Purchase Details
Closed on
May 29, 1996
Sold by
Westfield Miriam L and Westfield George R
Bought by
Saxton Anthony
Purchase Details
Closed on
May 17, 1995
Sold by
Brown Kimberly Jo and Bennett Cheryl Lynn
Bought by
Westfield Miriam L
Create a Home Valuation Report for This Property
The Home Valuation Report is an in-depth analysis detailing your home's value as well as a comparison with similar homes in the area
Home Values in the Area
Average Home Value in this Area
Purchase History
| Date | Buyer | Sale Price | Title Company |
|---|---|---|---|
| Lorainey Brian | $15,000 | Salem Oak Title Agency Inc | |
| Abj Llc | $5,500 | None Available | |
| Saxton Anthony | $30,000 | Commonwealth Land Title Ins | |
| Westfield Miriam L | -- | -- |
Source: Public Records
Tax History
| Year | Tax Paid | Tax Assessment Tax Assessment Total Assessment is a certain percentage of the fair market value that is determined by local assessors to be the total taxable value of land and additions on the property. | Land | Improvement |
|---|---|---|---|---|
| 2025 | $3,577 | $60,100 | $8,900 | $51,200 |
| 2024 | $3,420 | $43,500 | $8,900 | $34,600 |
| 2023 | $3,420 | $43,500 | $8,900 | $34,600 |
| 2022 | $3,270 | $43,500 | $8,900 | $34,600 |
| 2021 | $3,075 | $43,500 | $8,900 | $34,600 |
| 2020 | $3,075 | $43,500 | $8,900 | $34,600 |
| 2019 | $3,075 | $43,500 | $8,900 | $34,600 |
| 2018 | $3,008 | $43,500 | $8,900 | $34,600 |
| 2017 | $2,971 | $43,500 | $8,900 | $34,600 |
| 2016 | $4,084 | $104,300 | $14,800 | $89,500 |
| 2015 | $4,032 | $104,300 | $14,800 | $89,500 |
| 2014 | $4,011 | $104,300 | $14,800 | $89,500 |
Source: Public Records
Map
Nearby Homes
Your Personal Tour Guide
Ask me questions while you tour the home.