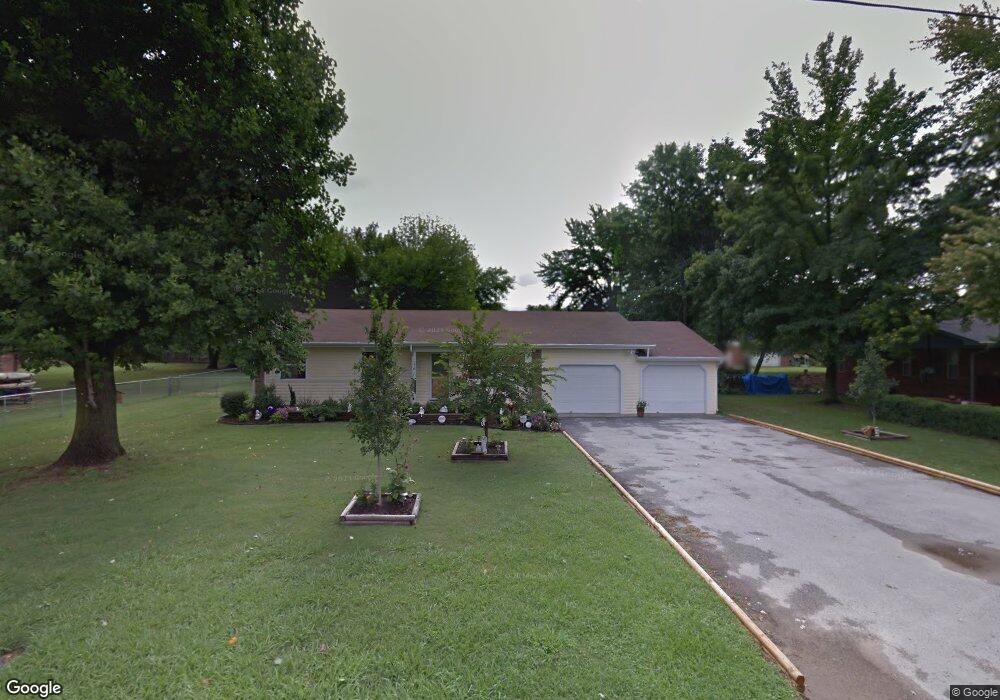
278 N Davis St Pea Ridge, AR 72751
Estimated Value: $239,000 - $301,000
--
Bed
2
Baths
1,772
Sq Ft
$158/Sq Ft
Est. Value
About This Home
This home is located at 278 N Davis St, Pea Ridge, AR 72751 and is currently estimated at $279,139, approximately $157 per square foot. 278 N Davis St is a home located in Benton County with nearby schools including Pea Ridge Intermediate School, Pea Ridge Primary School, and Pea Ridge Middle School.
Ownership History
Date
Name
Owned For
Owner Type
Purchase Details
Closed on
Apr 15, 2014
Sold by
Storlazzi Nancy
Bought by
Storlazzi Nancy and Nancy Storlazi Revocable Trust
Current Estimated Value
Purchase Details
Closed on
Jul 12, 1996
Bought by
Storlazzi
Purchase Details
Closed on
Jul 7, 1995
Bought by
Szukalski Liv Tr
Purchase Details
Closed on
Apr 24, 1995
Bought by
Dod 04-24-1995
Purchase Details
Closed on
Aug 18, 1992
Bought by
Szukalski
Purchase Details
Closed on
Nov 23, 1977
Bought by
Dubois
Create a Home Valuation Report for This Property
The Home Valuation Report is an in-depth analysis detailing your home's value as well as a comparison with similar homes in the area
Home Values in the Area
Average Home Value in this Area
Purchase History
| Date | Buyer | Sale Price | Title Company |
|---|---|---|---|
| Storlazzi Nancy | -- | None Available | |
| Storlazzi | $70,000 | -- | |
| Szukalski Liv Tr | -- | -- | |
| Dod 04-24-1995 | -- | -- | |
| Szukalski | $52,000 | -- | |
| Dubois | $27,000 | -- |
Source: Public Records
Tax History Compared to Growth
Tax History
| Year | Tax Paid | Tax Assessment Tax Assessment Total Assessment is a certain percentage of the fair market value that is determined by local assessors to be the total taxable value of land and additions on the property. | Land | Improvement |
|---|---|---|---|---|
| 2025 | $1,015 | $46,620 | $10,000 | $36,620 |
| 2024 | $1,041 | $46,620 | $10,000 | $36,620 |
| 2023 | $1,041 | $32,200 | $3,800 | $28,400 |
| 2022 | $712 | $32,200 | $3,800 | $28,400 |
| 2021 | $702 | $32,200 | $3,800 | $28,400 |
| 2020 | $738 | $20,050 | $2,800 | $17,250 |
| 2019 | $738 | $20,050 | $2,800 | $17,250 |
| 2018 | $868 | $20,050 | $2,800 | $17,250 |
| 2017 | $691 | $20,050 | $2,800 | $17,250 |
| 2016 | $691 | $20,050 | $2,800 | $17,250 |
| 2015 | $992 | $17,430 | $3,000 | $14,430 |
| 2014 | $642 | $17,430 | $3,000 | $14,430 |
Source: Public Records
Map
Nearby Homes