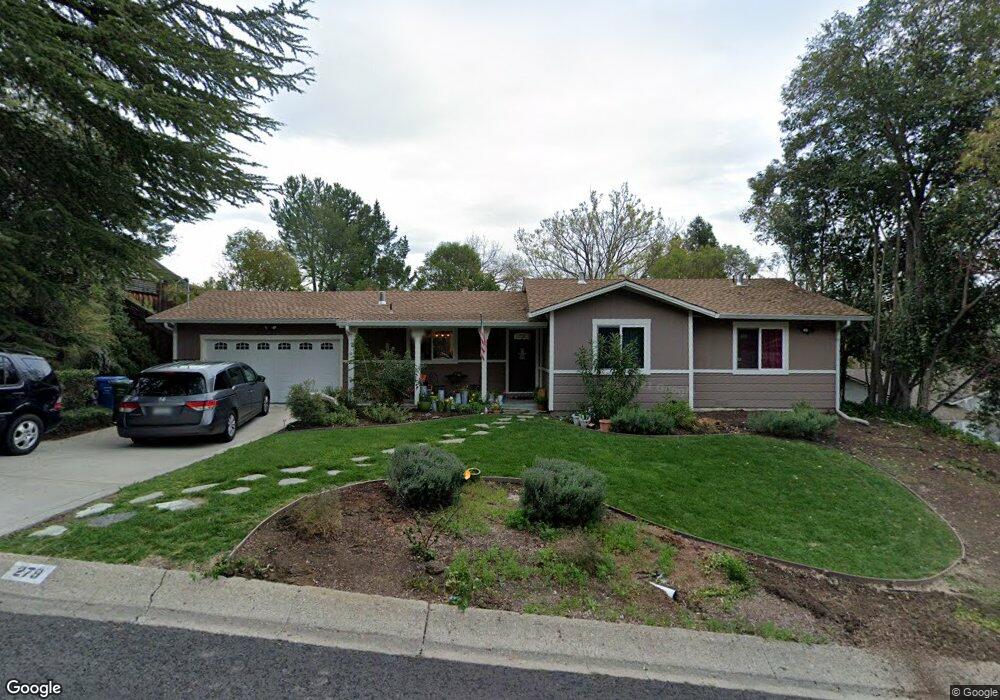
278 Via Cima Ct Danville, CA 94526
Estimated Value: $1,501,000 - $2,138,000
3
Beds
2
Baths
1,310
Sq Ft
$1,364/Sq Ft
Est. Value
About This Home
This home is located at 278 Via Cima Ct, Danville, CA 94526 and is currently estimated at $1,786,364, approximately $1,363 per square foot. 278 Via Cima Ct is a home located in Contra Costa County with nearby schools including Green Valley Elementary School, Los Cerros Middle School, and Monte Vista High School.
Ownership History
Date
Name
Owned For
Owner Type
Purchase Details
Closed on
Aug 25, 2011
Sold by
Halverson Susan M
Bought by
Gandhi She
Current Estimated Value
Home Financials for this Owner
Home Financials are based on the most recent Mortgage that was taken out on this home.
Original Mortgage
$368,000
Outstanding Balance
$253,488
Interest Rate
4.46%
Mortgage Type
New Conventional
Estimated Equity
$1,532,876
Purchase Details
Closed on
Aug 23, 2011
Sold by
Gandhi Kanwaljot
Bought by
Gandhi She
Home Financials for this Owner
Home Financials are based on the most recent Mortgage that was taken out on this home.
Original Mortgage
$368,000
Outstanding Balance
$253,488
Interest Rate
4.46%
Mortgage Type
New Conventional
Estimated Equity
$1,532,876
Purchase Details
Closed on
Oct 24, 2006
Sold by
Halverson Susan M
Bought by
Halverson Susan M
Purchase Details
Closed on
Jan 21, 1999
Sold by
Halverson Susan M
Bought by
Halverson James G
Create a Home Valuation Report for This Property
The Home Valuation Report is an in-depth analysis detailing your home's value as well as a comparison with similar homes in the area
Home Values in the Area
Average Home Value in this Area
Purchase History
| Date | Buyer | Sale Price | Title Company |
|---|---|---|---|
| Gandhi She | $460,000 | Chicago Title Company | |
| Gandhi She | -- | Chicago Title Company | |
| Halverson Susan M | -- | None Available | |
| Halverson James G | -- | North American Title Co | |
| Halverson James G | -- | North American Title Co |
Source: Public Records
Mortgage History
| Date | Status | Borrower | Loan Amount |
|---|---|---|---|
| Open | Gandhi She | $368,000 |
Source: Public Records
Tax History Compared to Growth
Tax History
| Year | Tax Paid | Tax Assessment Tax Assessment Total Assessment is a certain percentage of the fair market value that is determined by local assessors to be the total taxable value of land and additions on the property. | Land | Improvement |
|---|---|---|---|---|
| 2025 | $11,115 | $950,074 | $452,175 | $497,899 |
| 2024 | $8,843 | $931,446 | $443,309 | $488,137 |
| 2023 | $8,843 | $720,340 | $434,617 | $285,723 |
| 2022 | $6,996 | $544,452 | $426,096 | $118,356 |
| 2021 | $6,843 | $533,778 | $417,742 | $116,036 |
| 2019 | $6,682 | $517,948 | $405,352 | $112,596 |
| 2018 | $6,436 | $507,793 | $397,404 | $110,389 |
| 2017 | $6,200 | $497,837 | $389,612 | $108,225 |
| 2016 | $6,111 | $488,076 | $381,973 | $106,103 |
| 2015 | $6,025 | $480,746 | $376,236 | $104,510 |
| 2014 | $5,935 | $471,330 | $368,867 | $102,463 |
Source: Public Records
Map
Nearby Homes
- 190 Verde Mesa Dr
- 43 Pulido Ct
- 270 Cameo Dr
- 118 Feliz Ct
- 238 Cameo Dr
- 1023 White Gate Rd
- 298 Valle Vista Dr
- 117 Montana Dr
- 107 Verde Mesa Dr
- 1666 Green Valley Rd
- 1651 Green Valley Rd
- 20 Donna Ln
- 161 Maiden Ln
- 176 Mountain Canyon Ln
- 1850 Monte Sereno Dr
- 1923 Green Valley Rd
- 2592 Caballo Ranchero Dr
- 2540 Caballo Ranchero Dr
- 0 Caballo Ranchero Dr
- 1826 Alameda Diablo
- 270 Via Cima Ct
- 286 Via Cima Ct
- 279 Verde Mesa Dr
- 287 Verde Mesa Dr
- 262 Via Cima Ct
- 294 Via Cima Ct
- 271 Verde Mesa Dr
- 279 Via Cima Ct
- 263 Via Cima Ct
- 271 Via Cima Ct
- 287 Via Cima Ct
- 263 Verde Mesa Dr
- 198 Pulido Rd
- 298 Via Cima Ct
- 296 Verde Mesa Dr
- 293 Via Cima Ct
- 206 Pulido Rd
- 190 Pulido Rd
- 278 Verde Mesa Dr
- 307 Via Cima Ct