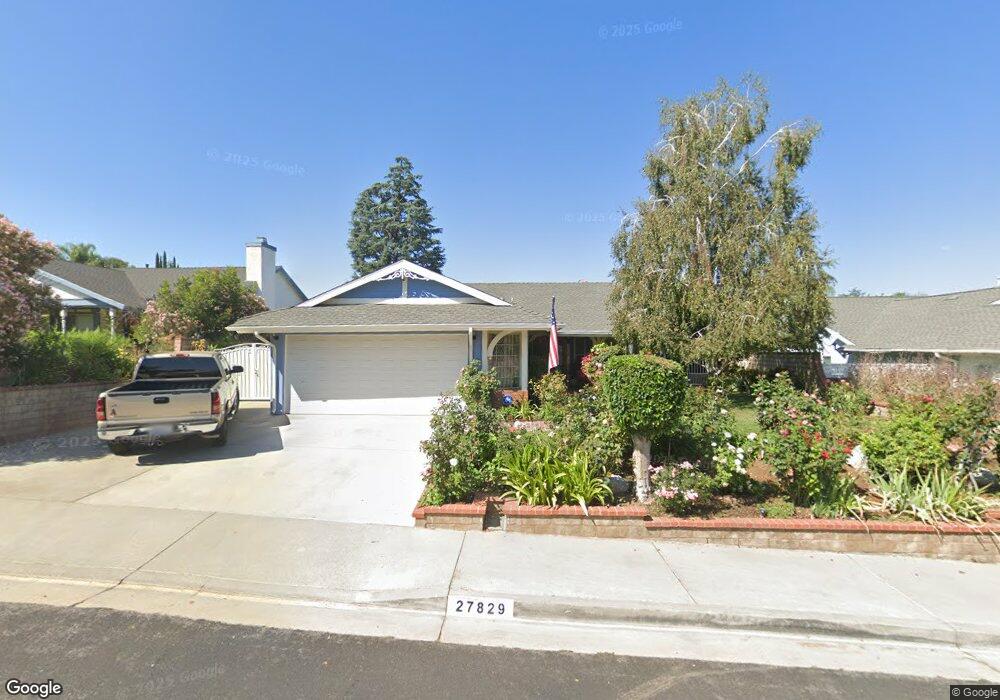
27829 Crookshank Dr Santa Clarita, CA 91350
Saugus NeighborhoodEstimated Value: $796,485 - $863,000
3
Beds
2
Baths
1,831
Sq Ft
$453/Sq Ft
Est. Value
About This Home
This home is located at 27829 Crookshank Dr, Santa Clarita, CA 91350 and is currently estimated at $828,871, approximately $452 per square foot. 27829 Crookshank Dr is a home located in Los Angeles County with nearby schools including James Foster Elementary School, Arroyo Seco Junior High School, and Saugus High School.
Ownership History
Date
Name
Owned For
Owner Type
Purchase Details
Closed on
Jul 9, 2015
Sold by
The Antonio & Maria Decesare Living Trus
Bought by
Antonio & Maria Decesare Living Trust
Current Estimated Value
Purchase Details
Closed on
Feb 15, 2008
Sold by
Decesare Antonio
Bought by
Decesare Antonio and Decesare Maria
Purchase Details
Closed on
Mar 27, 2007
Sold by
Cotta Tammy
Bought by
Decesare Antonio and Decesare Maria
Purchase Details
Closed on
Aug 13, 2002
Sold by
Hamilton John C
Bought by
Cotta Tammy
Home Financials for this Owner
Home Financials are based on the most recent Mortgage that was taken out on this home.
Original Mortgage
$230,000
Interest Rate
6.16%
Mortgage Type
Balloon
Purchase Details
Closed on
May 30, 2000
Sold by
Long David M
Bought by
Hamilton John C and Cotta Tammy
Home Financials for this Owner
Home Financials are based on the most recent Mortgage that was taken out on this home.
Original Mortgage
$185,000
Interest Rate
8.53%
Create a Home Valuation Report for This Property
The Home Valuation Report is an in-depth analysis detailing your home's value as well as a comparison with similar homes in the area
Home Values in the Area
Average Home Value in this Area
Purchase History
| Date | Buyer | Sale Price | Title Company |
|---|---|---|---|
| Antonio & Maria Decesare Living Trust | -- | None Available | |
| Decesare Antonio | -- | None Available | |
| Decesare Antonio | $534,000 | Southland Title | |
| Cotta Tammy | -- | North American Title Co | |
| Hamilton John C | $242,500 | Lawyers Title Company |
Source: Public Records
Mortgage History
| Date | Status | Borrower | Loan Amount |
|---|---|---|---|
| Previous Owner | Cotta Tammy | $230,000 | |
| Previous Owner | Hamilton John C | $185,000 |
Source: Public Records
Tax History Compared to Growth
Tax History
| Year | Tax Paid | Tax Assessment Tax Assessment Total Assessment is a certain percentage of the fair market value that is determined by local assessors to be the total taxable value of land and additions on the property. | Land | Improvement |
|---|---|---|---|---|
| 2025 | $2,552 | $140,373 | $39,288 | $101,085 |
| 2024 | $2,552 | $137,621 | $38,518 | $99,103 |
| 2023 | $2,448 | $134,923 | $37,763 | $97,160 |
| 2022 | $2,444 | $132,278 | $37,023 | $95,255 |
| 2021 | $2,396 | $129,686 | $36,298 | $93,388 |
| 2019 | $2,322 | $125,841 | $35,222 | $90,619 |
| 2018 | $2,192 | $123,375 | $34,532 | $88,843 |
| 2016 | $2,036 | $118,586 | $33,192 | $85,394 |
| 2015 | $1,960 | $116,806 | $32,694 | $84,112 |
| 2014 | $1,928 | $114,519 | $32,054 | $82,465 |
Source: Public Records
Map
Nearby Homes
- 27929 Dexter Dr
- 27573 Santa Clarita Rd
- 27829 Carnegie Ave
- 22617 Copper Hill Dr Unit 121
- 22713 Copper Hill Dr Unit 42
- 28114 Seco Canyon Rd Unit 156
- 28121 Seco Canyon Rd Unit 86
- 28123 Seco Canyon Rd Unit 94
- 27439 Santa Clarita Rd
- 22654 La Rochelle Dr
- 22660 La Rochelle Dr
- 28241 Tamarack Ln
- 28321 Evergreen Ln
- 27362 Santa Clarita Rd
- 22839 Banyan Place Unit 334
- 22440 Skylake Place
- 27717 Sequoia Glen Dr
- 28015 Tupelo Ridge Dr
- 28345 Seco Canyon Rd Unit 97
- 28341 Seco Canyon Rd Unit 107
- 27833 Crookshank Dr
- 27825 Crookshank Dr
- 27740 Spandau Dr
- 27732 Spandau Dr
- 27839 Crookshank Dr
- 27819 Crookshank Dr
- 27746 Spandau Dr
- 27726 Spandau Dr
- 27830 Crookshank Dr
- 27845 Crookshank Dr
- 27752 Spandau Dr
- 27815 Crookshank Dr
- 27720 Spandau Dr
- 27834 Crookshank Dr
- 27822 Crookshank Dr
- 27840 Crookshank Dr
- 27818 Crookshank Dr
- 27851 Crookshank Dr
- 27716 Spandau Dr
- 27758 Spandau Dr