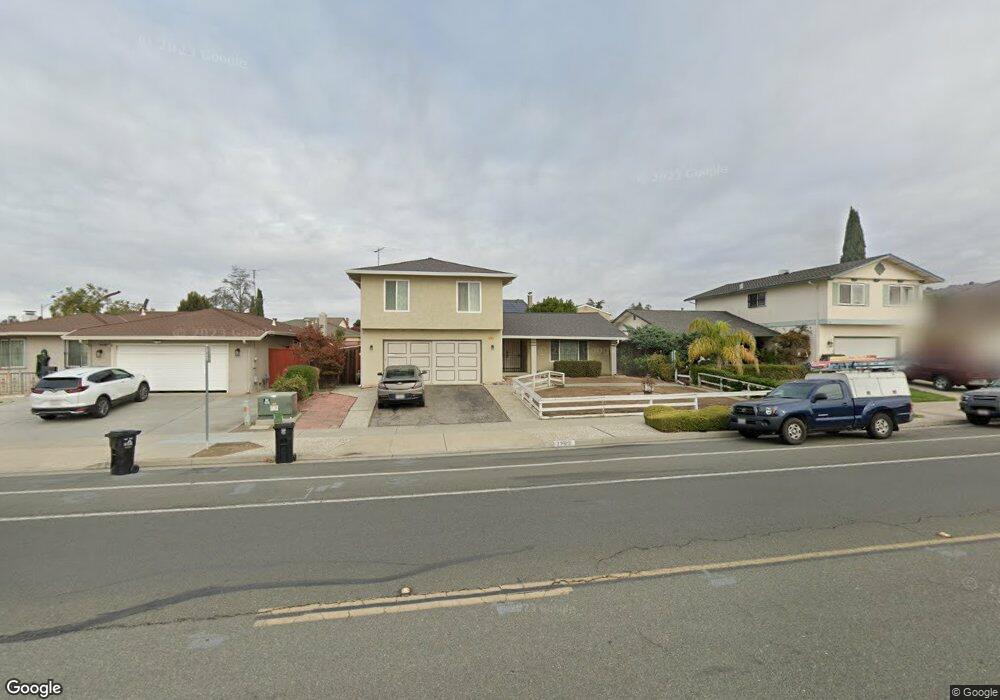
2783 Mabury Rd San Jose, CA 95133
Penitencia NeighborhoodEstimated Value: $1,449,000 - $1,644,000
4
Beds
3
Baths
1,787
Sq Ft
$860/Sq Ft
Est. Value
About This Home
This home is located at 2783 Mabury Rd, San Jose, CA 95133 and is currently estimated at $1,537,534, approximately $860 per square foot. 2783 Mabury Rd is a home located in Santa Clara County with nearby schools including Summerdale Elementary School, Piedmont Middle School, and Independence High School.
Ownership History
Date
Name
Owned For
Owner Type
Purchase Details
Closed on
Aug 10, 2019
Sold by
Lau Lucille Kim and Lau Lucille K
Bought by
Lau Kevin Wing and Lau Lucille Kim
Current Estimated Value
Purchase Details
Closed on
Mar 7, 2018
Sold by
Lau Lucille K and Chau Lucille K
Bought by
Lau Lucille K
Create a Home Valuation Report for This Property
The Home Valuation Report is an in-depth analysis detailing your home's value as well as a comparison with similar homes in the area
Home Values in the Area
Average Home Value in this Area
Purchase History
| Date | Buyer | Sale Price | Title Company |
|---|---|---|---|
| Lau Kevin Wing | -- | None Available | |
| Lau Lucille K | -- | None Available |
Source: Public Records
Tax History Compared to Growth
Tax History
| Year | Tax Paid | Tax Assessment Tax Assessment Total Assessment is a certain percentage of the fair market value that is determined by local assessors to be the total taxable value of land and additions on the property. | Land | Improvement |
|---|---|---|---|---|
| 2025 | $6,055 | $362,560 | $135,258 | $227,302 |
| 2024 | $6,055 | $355,452 | $132,606 | $222,846 |
| 2023 | $5,922 | $348,483 | $130,006 | $218,477 |
| 2022 | $5,891 | $341,651 | $127,457 | $214,194 |
| 2021 | $10,239 | $693,052 | $430,385 | $262,667 |
| 2020 | $9,925 | $685,946 | $425,972 | $259,974 |
| 2019 | $9,549 | $672,497 | $417,620 | $254,877 |
| 2018 | $5,100 | $318,647 | $118,875 | $199,772 |
| 2017 | $5,111 | $312,400 | $116,545 | $195,855 |
| 2016 | $4,895 | $306,275 | $114,260 | $192,015 |
| 2015 | $4,831 | $301,675 | $112,544 | $189,131 |
| 2014 | $4,275 | $295,767 | $110,340 | $185,427 |
Source: Public Records
Map
Nearby Homes
- 2714 Mabury Square
- 714 N Capitol Ave
- 2806 Glauser Dr
- 2623 Gimelli Place Unit 139
- 673 Kirk Glen Dr
- 693 Kirk Glen Dr
- 2599 Easton Ln Unit 108
- 2599 Easton Ln Unit 109
- 674 Galleon Ct
- 825 N Capitol Ave Unit 4
- 750 Fruit Ranch Loop
- 709 Whitewater Ct Unit 44
- 2580 Gimelli Way
- 633 Easton Dr
- 571 Apricot Way
- 559 Apricot Way
- 2432 Kita Ln
- 2420 Kita Ln
- 981 Harcot Ct
- 994 Harcot Ct
- 2789 Mabury Rd
- 2777 Mabury Rd
- 2776 Glen Heather Dr
- 2770 Glen Heather Dr
- 2795 Mabury Rd
- 2771 Mabury Rd
- 2782 Glen Heather Dr
- 2764 Glen Heather Dr
- 2788 Glen Heather Dr
- 2794 Valley Heights Dr
- 2765 Mabury Rd
- 2801 Mabury Rd
- 2758 Glen Heather Dr
- 697 Rough And Ready Rd
- 2794 Glen Heather Dr
- 2795 Valley Heights Dr
- 2790 Valley Heights Dr
- 2807 Mabury Rd
- 2757 Mabury Rd
- 2773 Glen Heather Dr