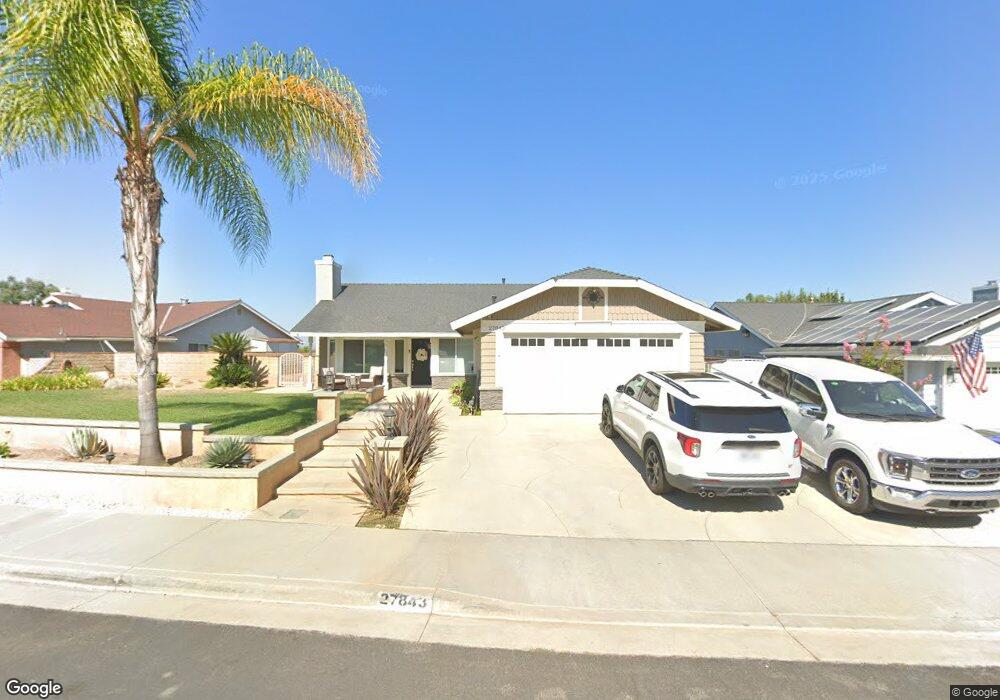
27843 Dexter Dr Santa Clarita, CA 91350
Saugus NeighborhoodEstimated Value: $788,246 - $848,000
3
Beds
2
Baths
1,608
Sq Ft
$513/Sq Ft
Est. Value
About This Home
This home is located at 27843 Dexter Dr, Santa Clarita, CA 91350 and is currently estimated at $825,312, approximately $513 per square foot. 27843 Dexter Dr is a home located in Los Angeles County with nearby schools including James Foster Elementary School, Arroyo Seco Junior High School, and Saugus High School.
Ownership History
Date
Name
Owned For
Owner Type
Purchase Details
Closed on
Mar 18, 2013
Sold by
Davis Siobhan
Bought by
Davis Brett A
Current Estimated Value
Home Financials for this Owner
Home Financials are based on the most recent Mortgage that was taken out on this home.
Original Mortgage
$280,000
Outstanding Balance
$197,140
Interest Rate
3.49%
Mortgage Type
New Conventional
Estimated Equity
$628,172
Purchase Details
Closed on
Apr 19, 2002
Sold by
Davis Gary Bruce and Davis Margie Elaine
Bought by
Davis Brett A and Davis Siobhan
Home Financials for this Owner
Home Financials are based on the most recent Mortgage that was taken out on this home.
Original Mortgage
$200,000
Interest Rate
7.13%
Purchase Details
Closed on
Aug 5, 1998
Sold by
St George Lawrence D And Susanne E
Bought by
Davis Brett A and Davis Siobhan
Home Financials for this Owner
Home Financials are based on the most recent Mortgage that was taken out on this home.
Original Mortgage
$152,600
Interest Rate
6.93%
Create a Home Valuation Report for This Property
The Home Valuation Report is an in-depth analysis detailing your home's value as well as a comparison with similar homes in the area
Home Values in the Area
Average Home Value in this Area
Purchase History
| Date | Buyer | Sale Price | Title Company |
|---|---|---|---|
| Davis Brett A | -- | Placer Title Company | |
| Davis Brett A | -- | Chicago Title Co | |
| Davis Brett A | $218,000 | Investors Title Company |
Source: Public Records
Mortgage History
| Date | Status | Borrower | Loan Amount |
|---|---|---|---|
| Open | Davis Brett A | $280,000 | |
| Closed | Davis Brett A | $200,000 | |
| Closed | Davis Brett A | $152,600 |
Source: Public Records
Tax History Compared to Growth
Tax History
| Year | Tax Paid | Tax Assessment Tax Assessment Total Assessment is a certain percentage of the fair market value that is determined by local assessors to be the total taxable value of land and additions on the property. | Land | Improvement |
|---|---|---|---|---|
| 2025 | $5,322 | $377,343 | $146,848 | $230,495 |
| 2024 | $5,322 | $369,945 | $143,969 | $225,976 |
| 2023 | $5,166 | $362,693 | $141,147 | $221,546 |
| 2022 | $5,184 | $355,582 | $138,380 | $217,202 |
| 2021 | $5,094 | $348,611 | $135,667 | $212,944 |
| 2019 | $4,914 | $338,273 | $131,644 | $206,629 |
| 2018 | $4,738 | $331,641 | $129,063 | $202,578 |
| 2016 | $4,465 | $318,764 | $124,052 | $194,712 |
| 2015 | $4,298 | $313,977 | $122,189 | $191,788 |
| 2014 | $4,230 | $307,828 | $119,796 | $188,032 |
Source: Public Records
Map
Nearby Homes
- 27929 Dexter Dr
- 27829 Carnegie Ave
- 22617 Copper Hill Dr Unit 121
- 27573 Santa Clarita Rd
- 22035 Conway Place
- 22713 Copper Hill Dr Unit 42
- 28114 Seco Canyon Rd Unit 156
- 21965 Jeffers Ln
- 27872 Cherry Creek Dr
- 22045 Milestone St
- 28419 Hidden Hills Dr
- 22654 La Rochelle Dr
- 22660 La Rochelle Dr
- 28241 Tamarack Ln
- 27439 Santa Clarita Rd
- 22440 Skylake Place
- 22025 Lytle Ct
- 28321 Evergreen Ln
- 28121 Seco Canyon Rd Unit 86
- 28123 Seco Canyon Rd Unit 94
- 27833 Dexter Dr
- 27903 Dexter Dr
- 22510 Holms Ct
- 22514 Holms Ct
- 27821 Dexter Dr
- 27842 Dexter Dr
- 27838 Dexter Dr
- 27846 Dexter Dr
- 27834 Dexter Dr
- 27902 Dexter Dr
- 22515 Holms Ct
- 27828 Dexter Dr
- 27818 Sumner Ave
- 27812 Sumner Ave
- 27906 Dexter Dr
- 27806 Sumner Ave
- 27824 Sumner Ave
- 27822 Dexter Dr
- 27910 Dexter Dr
- 27802 Sumner Ave