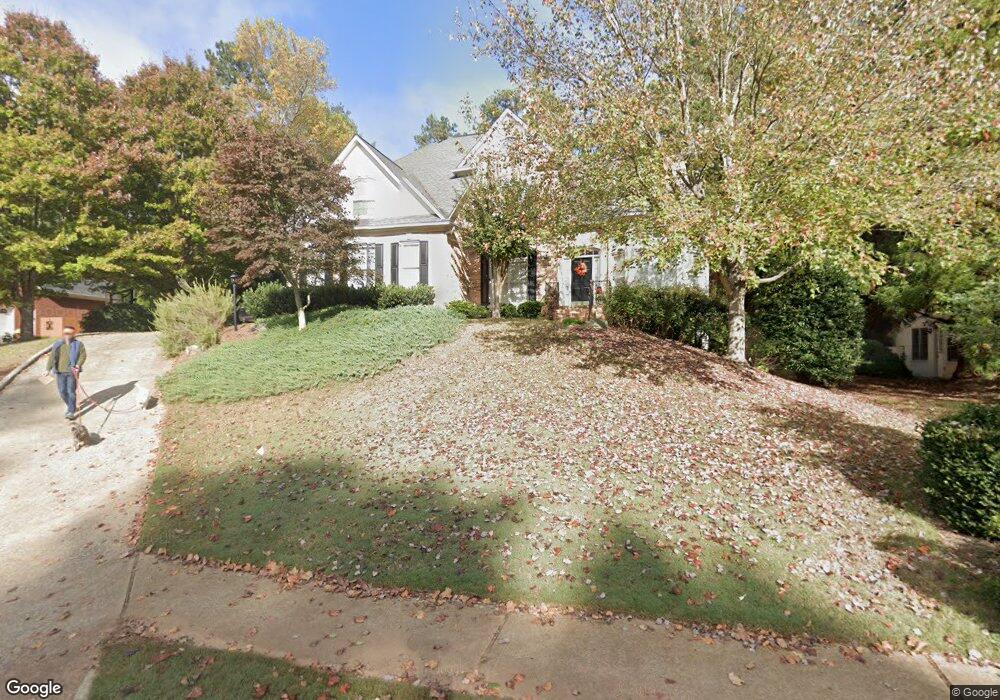
2785 Carillon Crossing Marietta, GA 30066
Sandy Plains NeighborhoodEstimated Value: $922,995 - $985,000
6
Beds
4
Baths
4,069
Sq Ft
$237/Sq Ft
Est. Value
About This Home
This home is located at 2785 Carillon Crossing, Marietta, GA 30066 and is currently estimated at $965,999, approximately $237 per square foot. 2785 Carillon Crossing is a home located in Cobb County with nearby schools including Mountain View Elementary School, Simpson Middle School, and Lassiter High School.
Ownership History
Date
Name
Owned For
Owner Type
Purchase Details
Closed on
Jul 30, 2008
Sold by
Sirva Relocation Credit Llc
Bought by
Grosse Geoffrey A and Ellis-Grosse Evelyn
Current Estimated Value
Home Financials for this Owner
Home Financials are based on the most recent Mortgage that was taken out on this home.
Original Mortgage
$385,000
Outstanding Balance
$252,868
Interest Rate
6.43%
Mortgage Type
New Conventional
Estimated Equity
$713,131
Purchase Details
Closed on
Mar 28, 2002
Sold by
Cassada Mark W and Cassada Suzanne Y
Bought by
Barton Philip N and Barton Heather L
Home Financials for this Owner
Home Financials are based on the most recent Mortgage that was taken out on this home.
Original Mortgage
$180,000
Interest Rate
6.98%
Mortgage Type
New Conventional
Purchase Details
Closed on
Aug 29, 1996
Sold by
John Wieland Homes Inc
Bought by
Cassada Mark W Suzanne Y
Create a Home Valuation Report for This Property
The Home Valuation Report is an in-depth analysis detailing your home's value as well as a comparison with similar homes in the area
Home Values in the Area
Average Home Value in this Area
Purchase History
| Date | Buyer | Sale Price | Title Company |
|---|---|---|---|
| Grosse Geoffrey A | $501,000 | -- | |
| Sirva Relocation Credit Llc | $530,000 | -- | |
| Barton Philip N | $465,000 | -- | |
| Cassada Mark W Suzanne Y | $297,000 | -- |
Source: Public Records
Mortgage History
| Date | Status | Borrower | Loan Amount |
|---|---|---|---|
| Open | Sirva Relocation Credit Llc | $385,000 | |
| Previous Owner | Barton Philip N | $180,000 | |
| Closed | Cassada Mark W Suzanne Y | $0 |
Source: Public Records
Tax History Compared to Growth
Tax History
| Year | Tax Paid | Tax Assessment Tax Assessment Total Assessment is a certain percentage of the fair market value that is determined by local assessors to be the total taxable value of land and additions on the property. | Land | Improvement |
|---|---|---|---|---|
| 2025 | $8,463 | $321,024 | $80,000 | $241,024 |
| 2024 | $8,469 | $321,024 | $80,000 | $241,024 |
| 2023 | $7,213 | $288,148 | $70,000 | $218,148 |
| 2022 | $6,549 | $230,452 | $54,400 | $176,052 |
| 2021 | $6,549 | $230,452 | $54,400 | $176,052 |
| 2020 | $6,110 | $210,396 | $54,400 | $155,996 |
| 2019 | $6,166 | $212,972 | $54,400 | $158,572 |
| 2018 | $6,166 | $212,972 | $54,400 | $158,572 |
| 2017 | $5,522 | $200,984 | $50,000 | $150,984 |
| 2016 | $5,523 | $200,984 | $50,000 | $150,984 |
| 2015 | $5,043 | $180,012 | $60,000 | $120,012 |
| 2014 | $5,086 | $180,012 | $0 | $0 |
Source: Public Records
Map
Nearby Homes
- 3283 Holly Springs Rd NE
- 3505 Bonaire Ct
- 3465 Staci Ct NE
- 2867 Holly Oaks Dr
- 2591 Sandy Dr
- 2864 Holly Oaks Dr
- 2477 Bobbie Dr
- 2415 Wistful Way
- 2403 Wistful Way
- 2427 Camata Place
- 3071 Intrepid Wake
- 3134 Hudson Pond Ln
- 3150 Trickum Rd NE Unit LOT 1
- 3150 Trickum Rd NE
- 3310 Rangers Gate
- 3663 Heatherwood Dr NE
- 2853 Wendwood Dr
- 2787 Carillon Crossing
- 2783 Carillon Crossing
- 3305 Cranmore Chase Unit B3
- 3307 Cranmore Chase
- 2812 Cranmore Ct Unit B3
- 3303 Cranmore Chase
- 2786 Carillon Crossing
- 2781 Carillon Crossing
- 3205 Talimore Cir Unit 1A
- 2788 Carillon Crossing
- 2810 Cranmore Ct
- 2784 Carillon Crossing
- 3301 Cranmore Chase Unit B3
- 2808 Cranmore Ct Unit B3
- 2790 Carillon Crossing
- 2779 Carillon Crossing
- 0 Cranmore Ct Unit 8974049
- 0 Cranmore Ct Unit 8584535
- 0 Cranmore Ct Unit 8528925
- 3311 Cranmore Chase