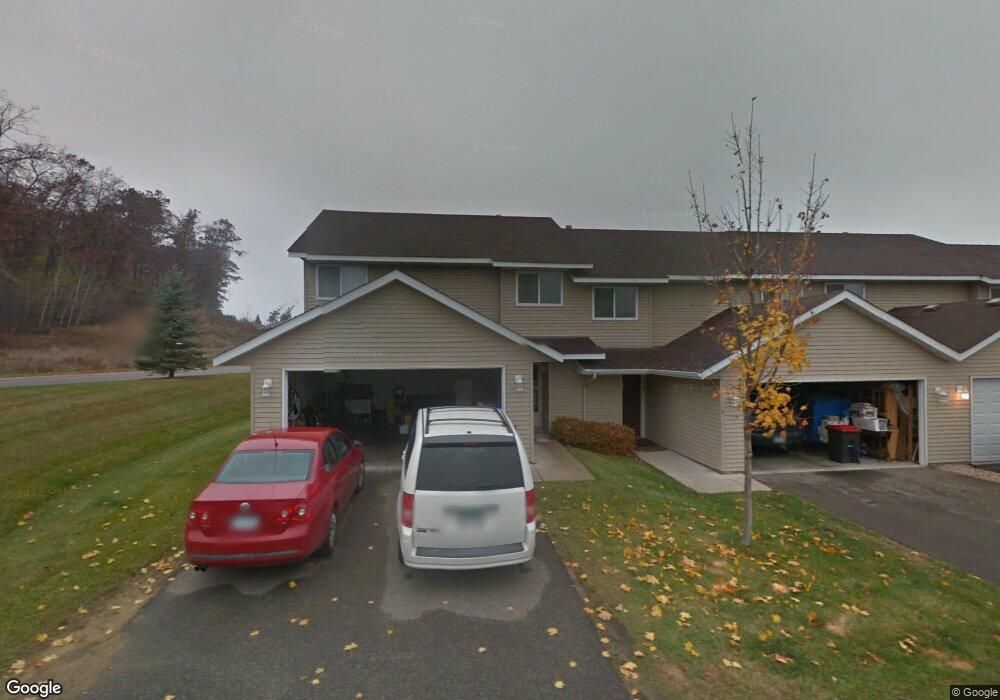
2786 Ridgeview Ln Red Wing, MN 55066
Estimated Value: $238,000 - $291,000
3
Beds
2
Baths
1,596
Sq Ft
$164/Sq Ft
Est. Value
About This Home
This home is located at 2786 Ridgeview Ln, Red Wing, MN 55066 and is currently estimated at $262,493, approximately $164 per square foot. 2786 Ridgeview Ln is a home located in Goodhue County with nearby schools including Sunnyside Elementary School, Burnside Elementary School, and Twin Bluff Middle School.
Ownership History
Date
Name
Owned For
Owner Type
Purchase Details
Closed on
Mar 22, 2022
Sold by
Robinson Claudia R and Robinson Nathan R
Bought by
Swenning David and Swenning Sandra
Current Estimated Value
Home Financials for this Owner
Home Financials are based on the most recent Mortgage that was taken out on this home.
Original Mortgage
$195,000
Outstanding Balance
$182,679
Interest Rate
4.16%
Mortgage Type
VA
Estimated Equity
$79,814
Purchase Details
Closed on
Apr 24, 2020
Sold by
Florez Jessica M and Florez John
Bought by
Wandel Amy A
Purchase Details
Closed on
Sep 23, 2019
Sold by
Nelson Bruce D and Nelson Sharon A
Bought by
Robinson Claudia and Robinson Nathan R
Purchase Details
Closed on
Nov 1, 2016
Sold by
Burkard Thomas W
Bought by
Nelson Bruce D and Nelson Sharon Ann
Purchase Details
Closed on
Apr 18, 2008
Sold by
Mn Johnson Construction Inc
Bought by
Burkard Thomas W
Create a Home Valuation Report for This Property
The Home Valuation Report is an in-depth analysis detailing your home's value as well as a comparison with similar homes in the area
Home Values in the Area
Average Home Value in this Area
Purchase History
| Date | Buyer | Sale Price | Title Company |
|---|---|---|---|
| Swenning David | $195,000 | None Listed On Document | |
| Wandel Amy A | $162,900 | Stewart Title | |
| Robinson Claudia | $162,500 | -- | |
| Nelson Bruce D | $134,500 | None Available | |
| Burkard Thomas W | $119,768 | -- |
Source: Public Records
Mortgage History
| Date | Status | Borrower | Loan Amount |
|---|---|---|---|
| Open | Swenning David | $195,000 |
Source: Public Records
Tax History
| Year | Tax Paid | Tax Assessment Tax Assessment Total Assessment is a certain percentage of the fair market value that is determined by local assessors to be the total taxable value of land and additions on the property. | Land | Improvement |
|---|---|---|---|---|
| 2025 | $2,982 | $245,900 | $25,000 | $220,900 |
| 2024 | $2,982 | $241,700 | $25,000 | $216,700 |
| 2023 | $1,487 | $227,000 | $25,000 | $202,000 |
| 2022 | $2,574 | $225,500 | $25,000 | $200,500 |
| 2021 | $2,222 | $189,200 | $25,000 | $164,200 |
| 2020 | $2,156 | $168,900 | $17,500 | $151,400 |
| 2019 | $2,166 | $155,300 | $17,500 | $137,800 |
| 2018 | $1,666 | $157,500 | $17,500 | $140,000 |
| 2017 | $1,640 | $135,200 | $17,500 | $117,700 |
| 2016 | $1,660 | $134,700 | $17,500 | $117,200 |
| 2015 | $1,590 | $119,200 | $12,500 | $106,700 |
| 2014 | -- | $110,700 | $25,000 | $85,700 |
Source: Public Records
Map
Nearby Homes
- 2773 Ridgeview Dr
- 1125 Hewitt Blvd
- 1181 Hewitt Blvd
- 113 Burnside Ave S
- 430 Harrison St
- 1330 Hillside Dr
- 1348 Hillside Dr
- 128 Charles Ave
- 131 Rose Ave
- 1815 Grandview Ave
- 717 Blaine St
- 3560 Graves Dr
- 1738 W 6th St
- 3557 Skyline Dr
- 1715 W 5th St
- 1828 Perlich Ave Unit 2G
- 3429 Helen Ln
- 186 Sargent Dr
- 1528 W 6th St
- 1757 Cobblestone Ct
- 2782 Ridgeview Ln
- 2776 Ridgeview Ln
- 1050 Hewitt Blvd
- 2772 Ridgeview Ln
- 1071 Fairview Blvd
- 2783 Ridgeview Ln
- 2787 Ridgeview Ln
- 2779 Ridgeview Ln
- 1071 Hewitt Blvd
- 1064 Hewitt Blvd
- 2775 Ridgeview Ln
- 1022 Hewitt Blvd
- 1077 Hewitt Blvd
- 1077 Hewitt Blvd
- 2769 Ridgeview Dr
- 2771 Ridgeview Ln
- 2765 Ridgeview Dr
- 2752 Ridgeview Ln
- 2756 Ridgeview Ln
- 2760 Ridgeview Ln
Your Personal Tour Guide
Ask me questions while you tour the home.