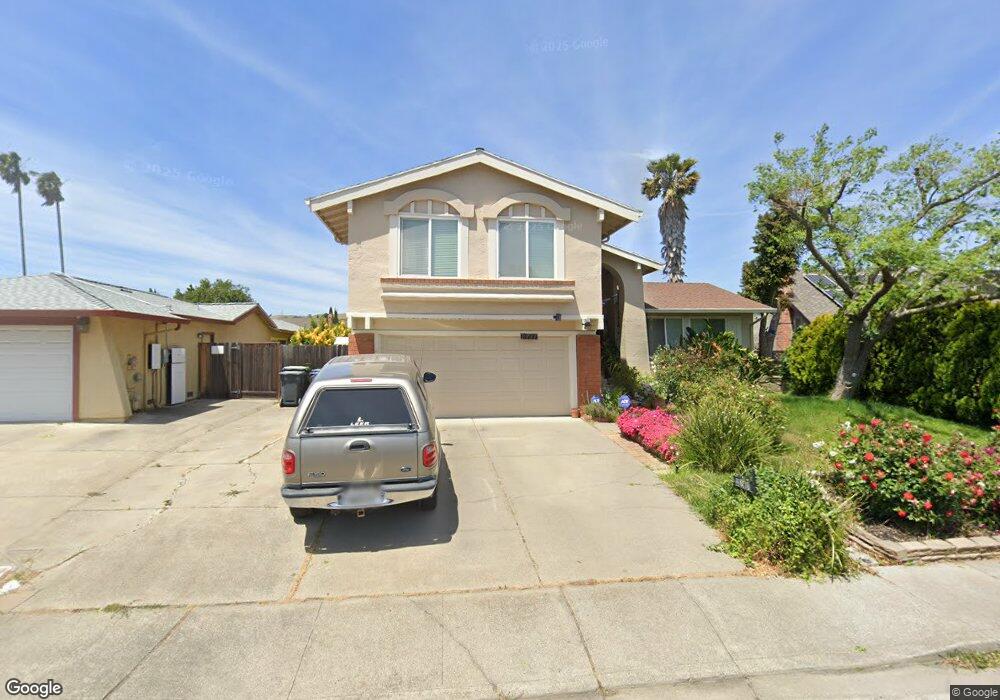
2787 Elmhurst Cir Fairfield, CA 94533
Estimated Value: $545,000 - $551,000
4
Beds
3
Baths
1,894
Sq Ft
$290/Sq Ft
Est. Value
About This Home
This home is located at 2787 Elmhurst Cir, Fairfield, CA 94533 and is currently estimated at $548,677, approximately $289 per square foot. 2787 Elmhurst Cir is a home located in Solano County with nearby schools including Dover Elementary School, Grange Middle School, and Fairfield High School.
Ownership History
Date
Name
Owned For
Owner Type
Purchase Details
Closed on
Sep 15, 2007
Sold by
Stump Roger and Stump Joyce
Bought by
Stump Roger C and Stump Joyce R
Current Estimated Value
Purchase Details
Closed on
Apr 6, 2001
Sold by
James David L
Bought by
Stump Roger C and Stump Joyce R
Home Financials for this Owner
Home Financials are based on the most recent Mortgage that was taken out on this home.
Original Mortgage
$255,700
Outstanding Balance
$94,752
Interest Rate
7.09%
Estimated Equity
$453,925
Purchase Details
Closed on
Apr 11, 1997
Sold by
James David L
Bought by
James David L and James Toni
Home Financials for this Owner
Home Financials are based on the most recent Mortgage that was taken out on this home.
Original Mortgage
$35,000
Interest Rate
7.86%
Create a Home Valuation Report for This Property
The Home Valuation Report is an in-depth analysis detailing your home's value as well as a comparison with similar homes in the area
Home Values in the Area
Average Home Value in this Area
Purchase History
| Date | Buyer | Sale Price | Title Company |
|---|---|---|---|
| Stump Roger C | -- | None Available | |
| Stump Roger C | $239,000 | Frontier Title Company | |
| James David L | -- | North American Title Co |
Source: Public Records
Mortgage History
| Date | Status | Borrower | Loan Amount |
|---|---|---|---|
| Open | Stump Roger C | $255,700 | |
| Previous Owner | James David L | $35,000 |
Source: Public Records
Tax History
| Year | Tax Paid | Tax Assessment Tax Assessment Total Assessment is a certain percentage of the fair market value that is determined by local assessors to be the total taxable value of land and additions on the property. | Land | Improvement |
|---|---|---|---|---|
| 2025 | $3,952 | $360,127 | $75,339 | $284,788 |
| 2024 | $3,952 | $353,066 | $73,862 | $279,204 |
| 2023 | $3,829 | $346,144 | $72,414 | $273,730 |
| 2022 | $3,781 | $339,358 | $70,995 | $268,363 |
| 2021 | $3,742 | $332,704 | $69,603 | $263,101 |
| 2020 | $3,654 | $329,294 | $68,890 | $260,404 |
| 2019 | $3,562 | $322,839 | $67,540 | $255,299 |
| 2018 | $3,676 | $316,510 | $66,216 | $250,294 |
| 2017 | $3,504 | $310,305 | $64,918 | $245,387 |
| 2016 | $3,475 | $304,222 | $63,646 | $240,576 |
| 2015 | $3,243 | $299,653 | $62,690 | $236,963 |
| 2014 | $3,148 | $288,000 | $49,000 | $239,000 |
Source: Public Records
Map
Nearby Homes
- 2827 Sunburst Dr
- 2825 Sundown Cir
- 2936 Sunbird Dr
- 500 Asbury Ln
- 2915 N Texas St Unit 129
- 2915 N Texas St Unit 157
- 432 Chelsea Way
- 445 Lakehurst Ct
- 570 Berkeley Way
- 2731 Orchid St
- 497 Americano Way
- 3265 Arroyo Dr
- 3276 Arroyo Dr
- 209 Begonia Blvd
- 2450 Oceanic Dr
- 278 Jasmine St
- 772 Largo Ct
- 2924 Redwood Dr
- 400 Santa Maria Dr
- 2532 Beaufort Ct
- 2791 Elmhurst Cir
- 2775 Elmhurst Cir
- 2795 Elmhurst Cir
- 2784 Elmhurst Cir
- 2790 Elmhurst Cir
- 2778 Elmhurst Cir
- 2769 Elmhurst Cir
- 395 Arlington Cir
- 397 Arlington Cir
- 2799 Elmhurst Cir
- 2772 Elmhurst Cir
- 393 Arlington Cir
- 2796 Elmhurst Cir
- 399 Arlington Cir
- 2766 Elmhurst Cir
- 2763 Elmhurst Cir
- 454 Blakemore Ct
- 462 Blakemore Ct
- 446 Blakemore Ct
Your Personal Tour Guide
Ask me questions while you tour the home.