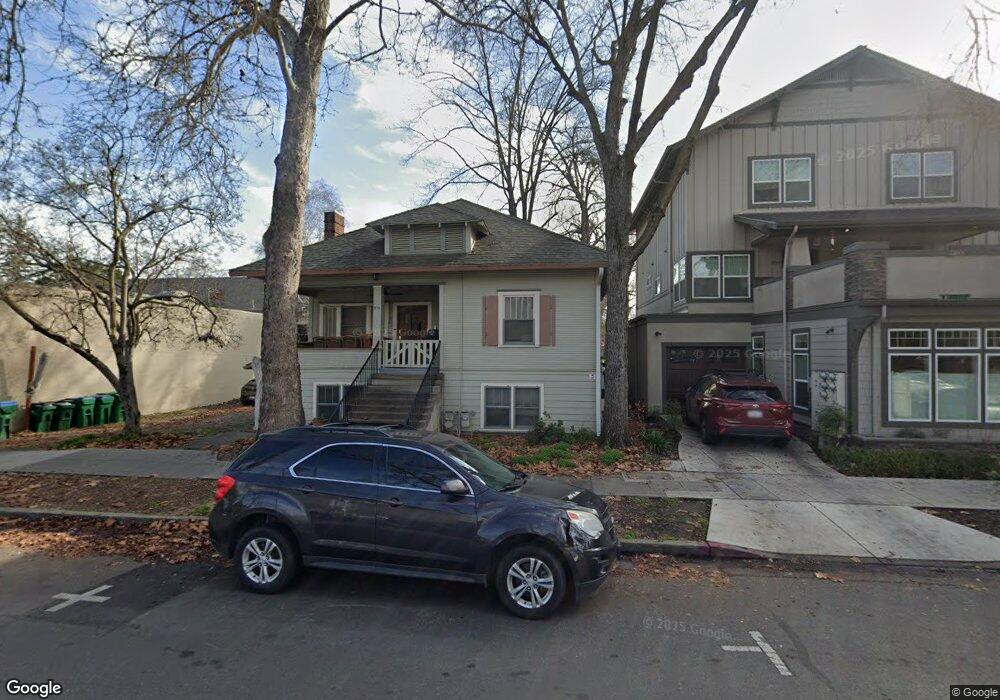
279 E 3rd St Chico, CA 95928
Downtown Chico NeighborhoodEstimated Value: $471,000 - $530,000
4
Beds
2
Baths
2,127
Sq Ft
$238/Sq Ft
Est. Value
About This Home
This home is located at 279 E 3rd St, Chico, CA 95928 and is currently estimated at $506,012, approximately $237 per square foot. 279 E 3rd St is a home located in Butte County with nearby schools including Parkview Elementary School, Chico Junior High School, and Chico High School.
Ownership History
Date
Name
Owned For
Owner Type
Purchase Details
Closed on
Oct 24, 2015
Sold by
Chico Properties
Bought by
South Chico Chicas Llc
Current Estimated Value
Purchase Details
Closed on
Jun 14, 2012
Sold by
Johnson Ann Williamson and Ann Williamson Johnson Family
Bought by
Chico Properties
Purchase Details
Closed on
Feb 16, 2012
Sold by
Johnson Ann Williamson
Bought by
Johnson Ann Williamson and Ann Williamson Johnson Family Trust
Purchase Details
Closed on
Dec 20, 2011
Sold by
Johnson Ann Williamson and The G Gordon Williamson Exempt
Bought by
Williamson James P and Johnson Ann Williamson
Purchase Details
Closed on
Aug 17, 2000
Sold by
Williamson Margaret K
Bought by
Williamson Margaret K and The Peg Williamson Family Trust
Create a Home Valuation Report for This Property
The Home Valuation Report is an in-depth analysis detailing your home's value as well as a comparison with similar homes in the area
Home Values in the Area
Average Home Value in this Area
Purchase History
| Date | Buyer | Sale Price | Title Company |
|---|---|---|---|
| South Chico Chicas Llc | $415,000 | Mid Valley Title & Escrow Co | |
| Chico Properties | -- | None Available | |
| Johnson Ann Williamson | -- | None Available | |
| Williamson James P | -- | None Available | |
| Williamson James P | -- | None Available | |
| Williamson Margaret K | -- | -- |
Source: Public Records
Tax History
| Year | Tax Paid | Tax Assessment Tax Assessment Total Assessment is a certain percentage of the fair market value that is determined by local assessors to be the total taxable value of land and additions on the property. | Land | Improvement |
|---|---|---|---|---|
| 2025 | $5,980 | $492,269 | $189,404 | $302,865 |
| 2024 | $5,980 | $481,638 | $185,691 | $295,947 |
| 2023 | $5,918 | $473,195 | $182,050 | $291,145 |
| 2022 | $5,804 | $463,937 | $178,481 | $285,456 |
| 2021 | $5,671 | $454,861 | $174,982 | $279,879 |
| 2020 | $5,640 | $450,208 | $173,188 | $277,020 |
| 2019 | $5,548 | $441,401 | $169,793 | $271,608 |
| 2018 | $5,441 | $432,766 | $166,464 | $266,302 |
| 2017 | $5,342 | $424,300 | $163,200 | $261,100 |
| 2016 | $4,377 | $416,000 | $160,000 | $256,000 |
| 2015 | $1,064 | $98,969 | $16,009 | $82,960 |
| 2014 | $1,039 | $97,051 | $15,696 | $81,355 |
Source: Public Records
Map
Nearby Homes
- 271 E 8th St
- 0 California 32
- 686 E 7th St
- 667 E 8th St
- 555 Vallombrosa Ave Unit 14
- 555 Vallombrosa Ave Unit 25
- 541 W 5th St
- 1001 Salem St
- 1029 Salem St
- 1224 Locust St
- 827 Arbutus Ave
- 363 E 1st Ave
- 1050 Esplanade
- 0 W 7th St
- 225 W 12th St
- 256 E 1st Ave
- 168 E 1st Ave
- 557 E 1st Ave
- 1022 Linden St
- 1080 Ivy St
- 295 E 3rd St
- 269 E 3rd St
- 310 Flume St Unit A
- 315 Wall St
- 330 Flume St
- 315 Wall St
- 315 Wall St Unit 7
- 315 Wall St Unit 14
- 315 Wall St Unit 12
- 315 Wall St Unit 9
- 315 Wall St Unit 10
- 305 Wall St
- 344 Flume St Unit 286
- 344 Flume St Unit C
- 344 Flume St Unit G
- 344 Flume St Unit B
- 344 Flume St Unit E
- 344 Flume St Unit AB
- 344 Flume St Unit H
- 344 Flume St
Your Personal Tour Guide
Ask me questions while you tour the home.