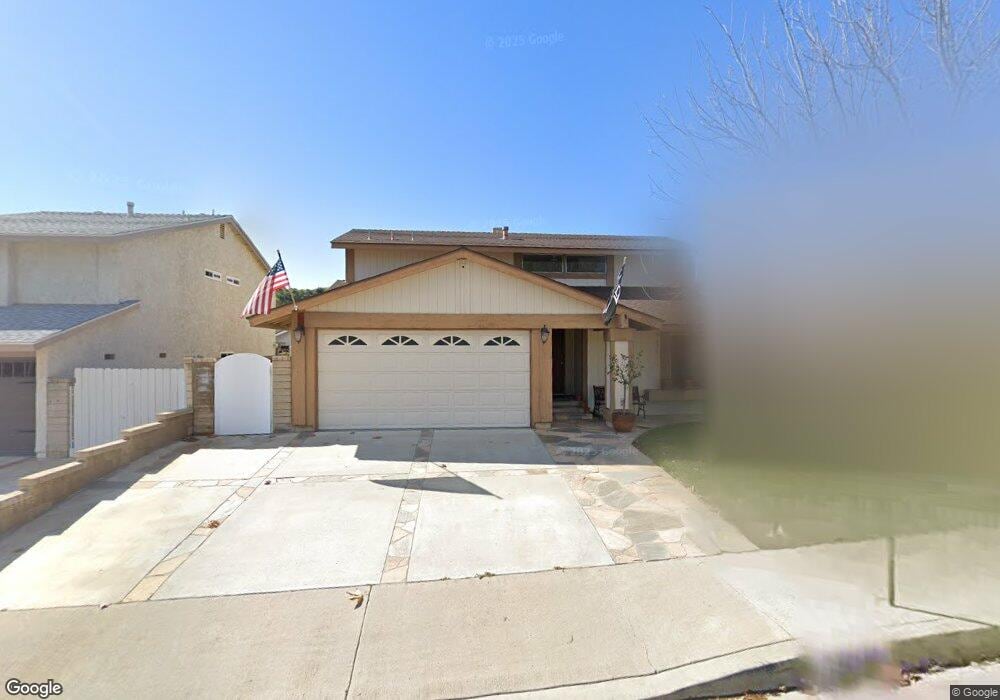
27923 Caraway Ln Santa Clarita, CA 91350
Saugus NeighborhoodEstimated Value: $817,000 - $836,927
4
Beds
3
Baths
1,752
Sq Ft
$473/Sq Ft
Est. Value
About This Home
This home is located at 27923 Caraway Ln, Santa Clarita, CA 91350 and is currently estimated at $829,482, approximately $473 per square foot. 27923 Caraway Ln is a home located in Los Angeles County with nearby schools including Rosedell Elementary School, Arroyo Seco Junior High School, and Saugus High School.
Ownership History
Date
Name
Owned For
Owner Type
Purchase Details
Closed on
Nov 16, 2019
Sold by
Verga Edward J
Bought by
Verga Edward J
Current Estimated Value
Home Financials for this Owner
Home Financials are based on the most recent Mortgage that was taken out on this home.
Original Mortgage
$464,000
Outstanding Balance
$407,383
Interest Rate
3.5%
Estimated Equity
$422,099
Purchase Details
Closed on
Dec 22, 2018
Sold by
Verga Edward J and Verga Deana M
Bought by
Verga Edward J
Home Financials for this Owner
Home Financials are based on the most recent Mortgage that was taken out on this home.
Original Mortgage
$440,000
Interest Rate
4.37%
Mortgage Type
Adjustable Rate Mortgage/ARM
Purchase Details
Closed on
Nov 17, 2000
Sold by
Rivera Samuel and Rivera Luz I
Bought by
Verga Edward J and Verga Deana M
Home Financials for this Owner
Home Financials are based on the most recent Mortgage that was taken out on this home.
Original Mortgage
$206,800
Interest Rate
7.67%
Create a Home Valuation Report for This Property
The Home Valuation Report is an in-depth analysis detailing your home's value as well as a comparison with similar homes in the area
Home Values in the Area
Average Home Value in this Area
Purchase History
| Date | Buyer | Sale Price | Title Company |
|---|---|---|---|
| Verga Edward J | -- | Wfg National Title Co Of Ca | |
| Verga Edward J | -- | Wfg National Title Company | |
| Verga Edward J | $230,000 | Equity Title |
Source: Public Records
Mortgage History
| Date | Status | Borrower | Loan Amount |
|---|---|---|---|
| Open | Verga Edward J | $464,000 | |
| Previous Owner | Verga Edward J | $440,000 | |
| Previous Owner | Verga Edward J | $206,800 |
Source: Public Records
Tax History Compared to Growth
Tax History
| Year | Tax Paid | Tax Assessment Tax Assessment Total Assessment is a certain percentage of the fair market value that is determined by local assessors to be the total taxable value of land and additions on the property. | Land | Improvement |
|---|---|---|---|---|
| 2025 | $5,278 | $387,297 | $182,618 | $204,679 |
| 2024 | $5,278 | $379,704 | $179,038 | $200,666 |
| 2023 | $5,138 | $372,260 | $175,528 | $196,732 |
| 2022 | $5,158 | $364,962 | $172,087 | $192,875 |
| 2021 | $5,067 | $357,807 | $168,713 | $189,094 |
| 2019 | $4,883 | $347,197 | $163,710 | $183,487 |
| 2018 | $4,738 | $340,390 | $160,500 | $179,890 |
| 2016 | $4,470 | $327,173 | $154,268 | $172,905 |
| 2015 | $4,305 | $322,259 | $151,951 | $170,308 |
| 2014 | $4,239 | $315,947 | $148,975 | $166,972 |
Source: Public Records
Map
Nearby Homes
- 28050 Devon Ln
- 28123 Bobwhite Cir Unit 104
- 21741 Jeffers Ln
- 21643 Masterson Ct
- 21560 Quinn Place
- 21929 Peppercorn Dr
- 27632 Kevin Place
- 27610 Kevin Place
- 21965 Jeffers Ln
- 28303 Sycamore Dr
- 27571 Caraway Ln
- 21983 Centurion Way
- 27620 Susan Beth Way Unit A
- 28340 Sycamore Dr
- 21558 Oak Dr Unit 78
- 27547 Saffron Ln
- 21123 Avenida de Sonrisa
- 21553 Oak Dr Unit 115
- 21827 Centurion Way
- 27828 Parkvale Dr
- 27917 Caraway Ln
- 27933 Caraway Ln
- 27911 Oregano Cir
- 27917 Oregano Cir
- 27909 Caraway Ln
- 27939 Caraway Ln
- 21613 Spice Ct
- 27922 Caraway Ln
- 27916 Caraway Ln
- 21619 Spice Ct
- 27905 Caraway Ln
- 27910 Caraway Ln
- 27929 Oregano Cir
- 27904 Caraway Ln
- 21631 Spice Ct
- 27953 Caraway Ln
- 27900 Caraway Ln
- 27924 Oregano Cir
- 27935 Oregano Cir
- 21637 Spice Ct